Move Trace Debugger
The Move Trace Debugger extension for Visual Studio Code provides a familiar debugging interface for Move unit tests and on-chain transactions, including PTB debugging support. You can inspect the state of PTB commands, step through code execution, track local variable values, and set line breakpoints for Move code, either in unit tests or in on-chain Move calls.
Debugging is enabled via trace generation: traces can be generated during unit test execution or during on-chain transaction replay.
Install
Use the debugger by installing the Move extension, which includes the Move Trace Debugger extension; you do not need to install it separately. The install instructions are included for certain cases where a separate install might be necessary.
The Move Trace Debugger extension is available in the Visual Studio Code Marketplace. Search for Move Trace Debugger in the Extensions view, or press Ctrl + P or ⌘ + P and type ext install mysten.move-trace-debug.
Alternatively, run code --install-extension mysten.move-trace-debug to install the extension from the command line.
To generate unit execution traces that enable unit test and on-chain transaction debugging, you need the sui binary installed with the tracing feature flag enabled. The sui binaries included in release tarballs, Homebrew, and Chocolatey installations have this feature enabled. See Install Sui for more information.
Features
The debugger provides a common set of features for all Move code debugging, whether you're debugging Move unit tests or on-chain Move calls. When debugging on-chain transactions, a Move call is just one of many PTB commands. The debugger supports inspecting not only the Move call itself, but also the state and execution of all remaining native PTB commands.
Move code debugging features
Currently, the Move Trace Debugger supports forward debugging through execution traces. Reverse debugging is not currently available.
Disassembly and source-level debugging
Source code for debugging unit tests is available by definition, and when starting a debug session for unit tests, you will find yourself in the source view.
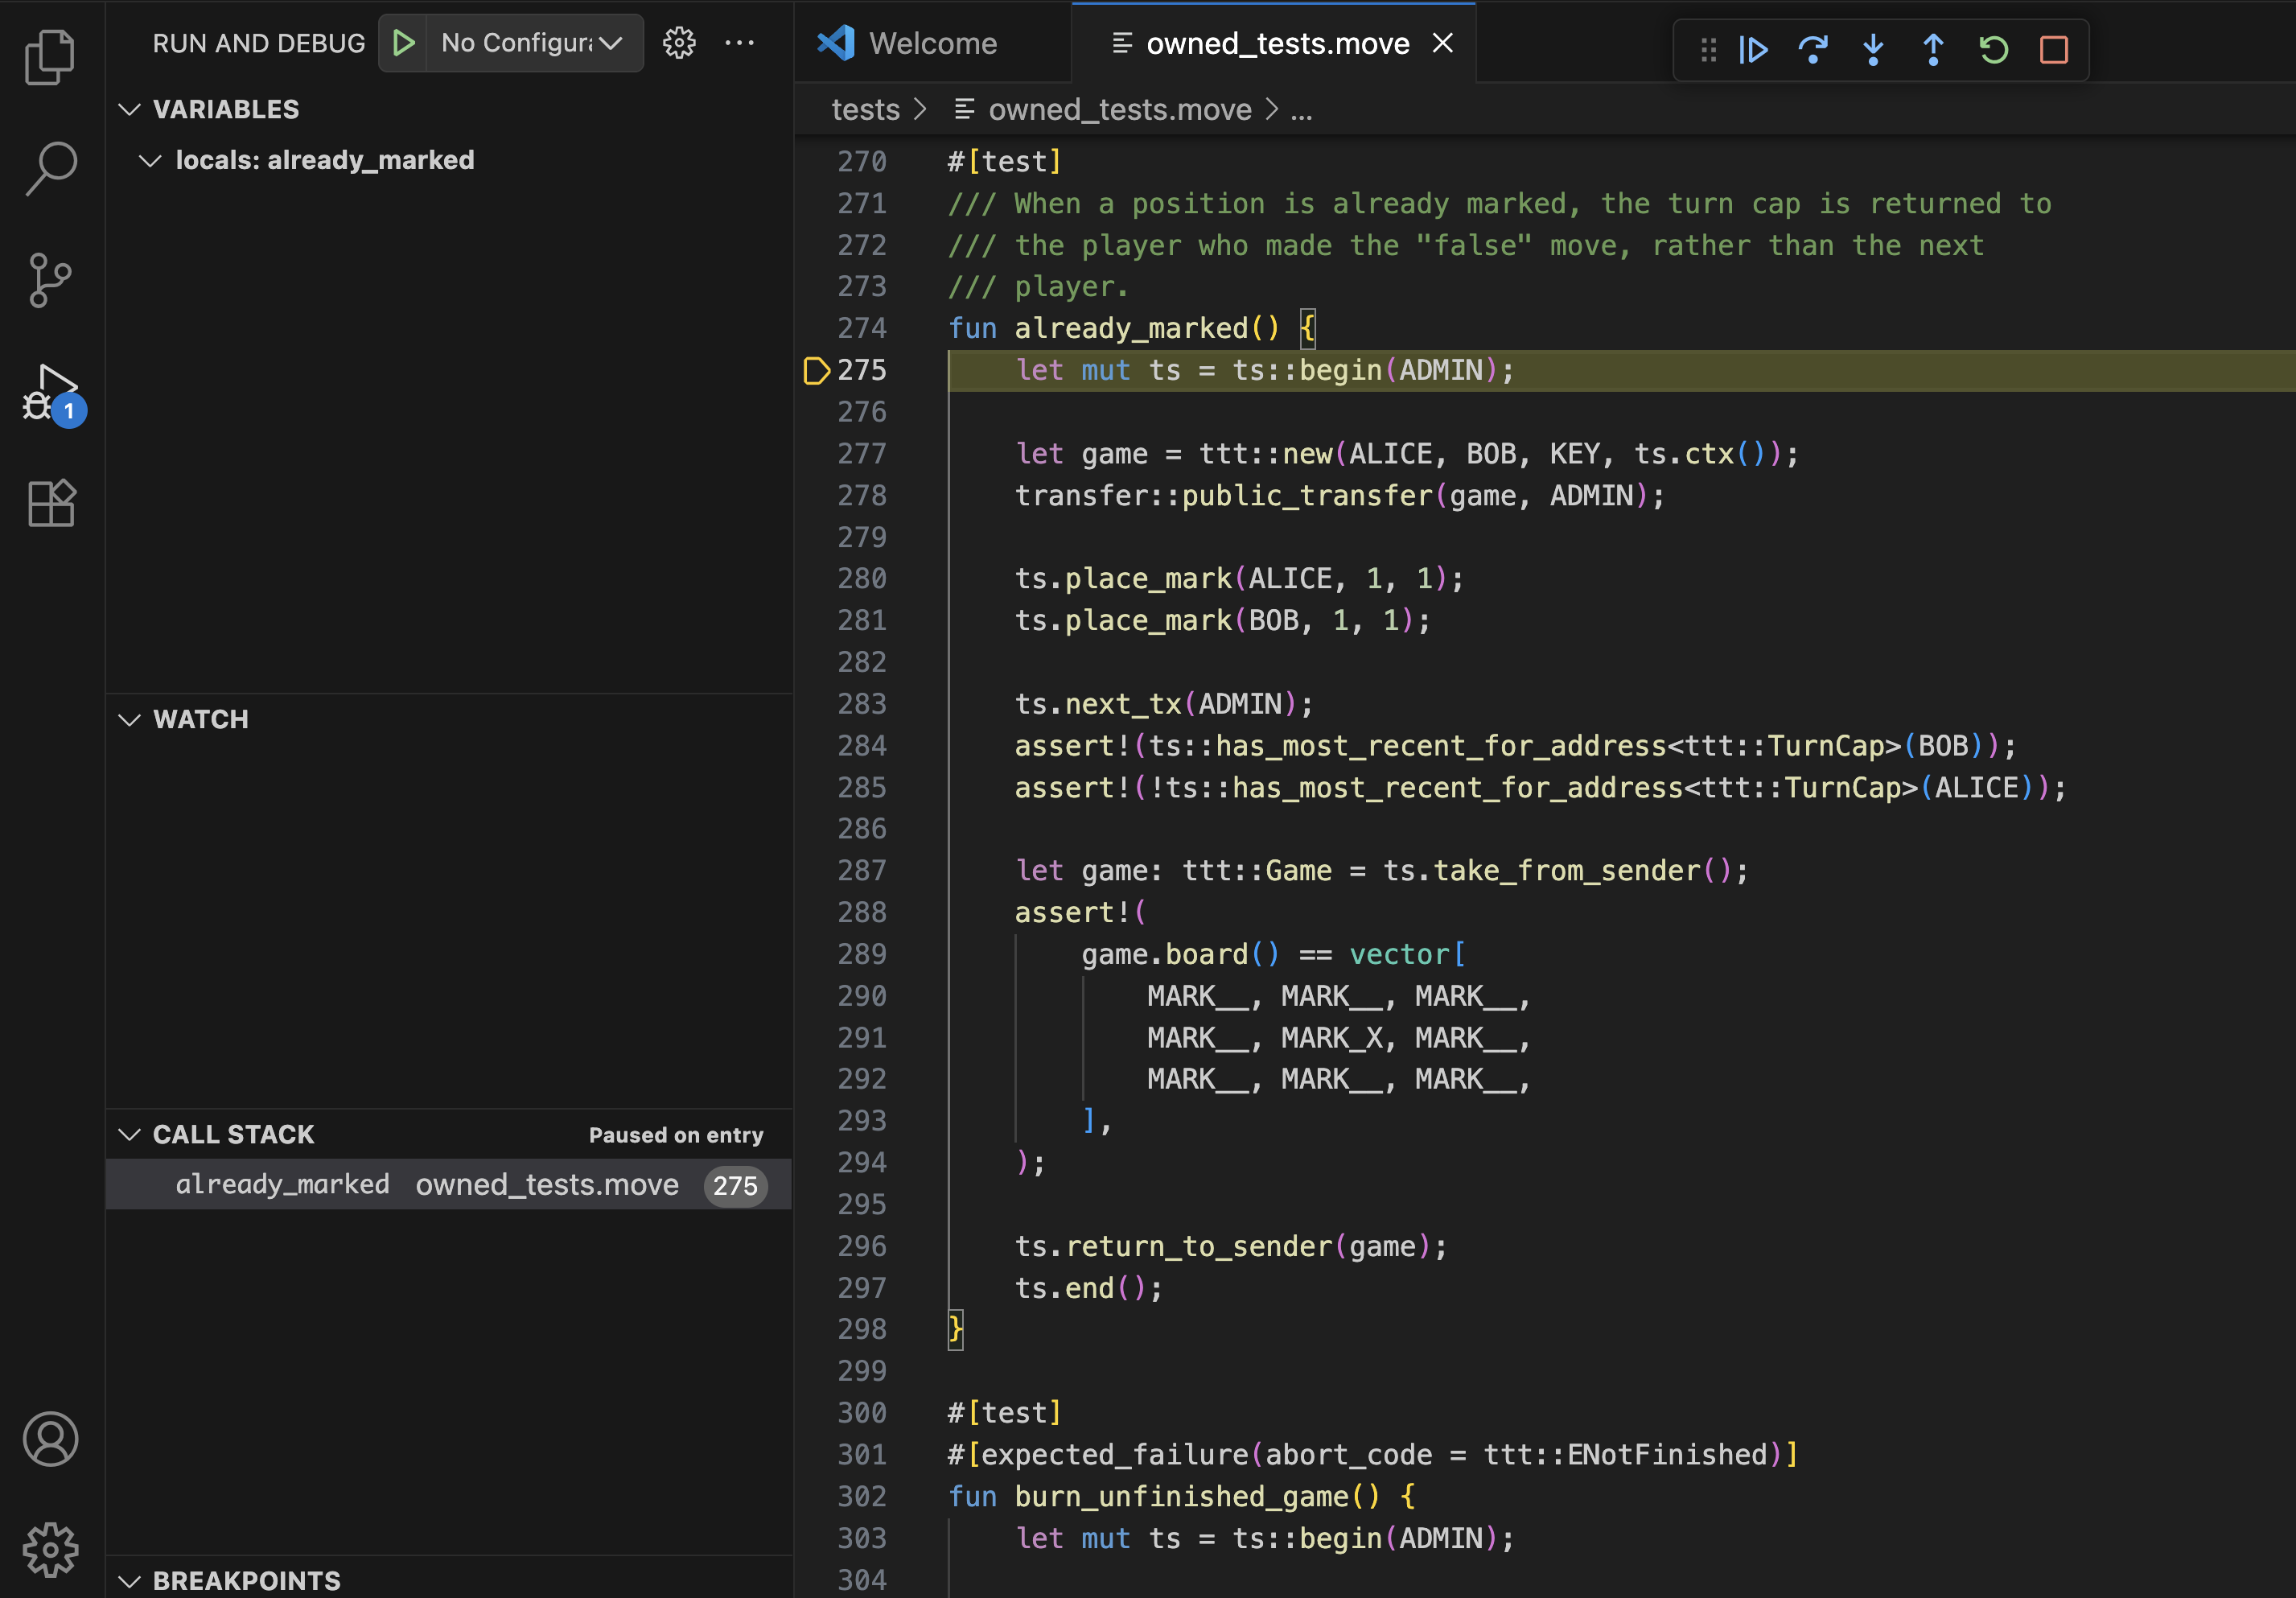
When debugging an on-chain transaction, the source code for Move calls executed within the transaction is not available by default, as it is not stored on-chain. A debug session will start in the disassembly view where Move code is represented by disassembled bytecode.
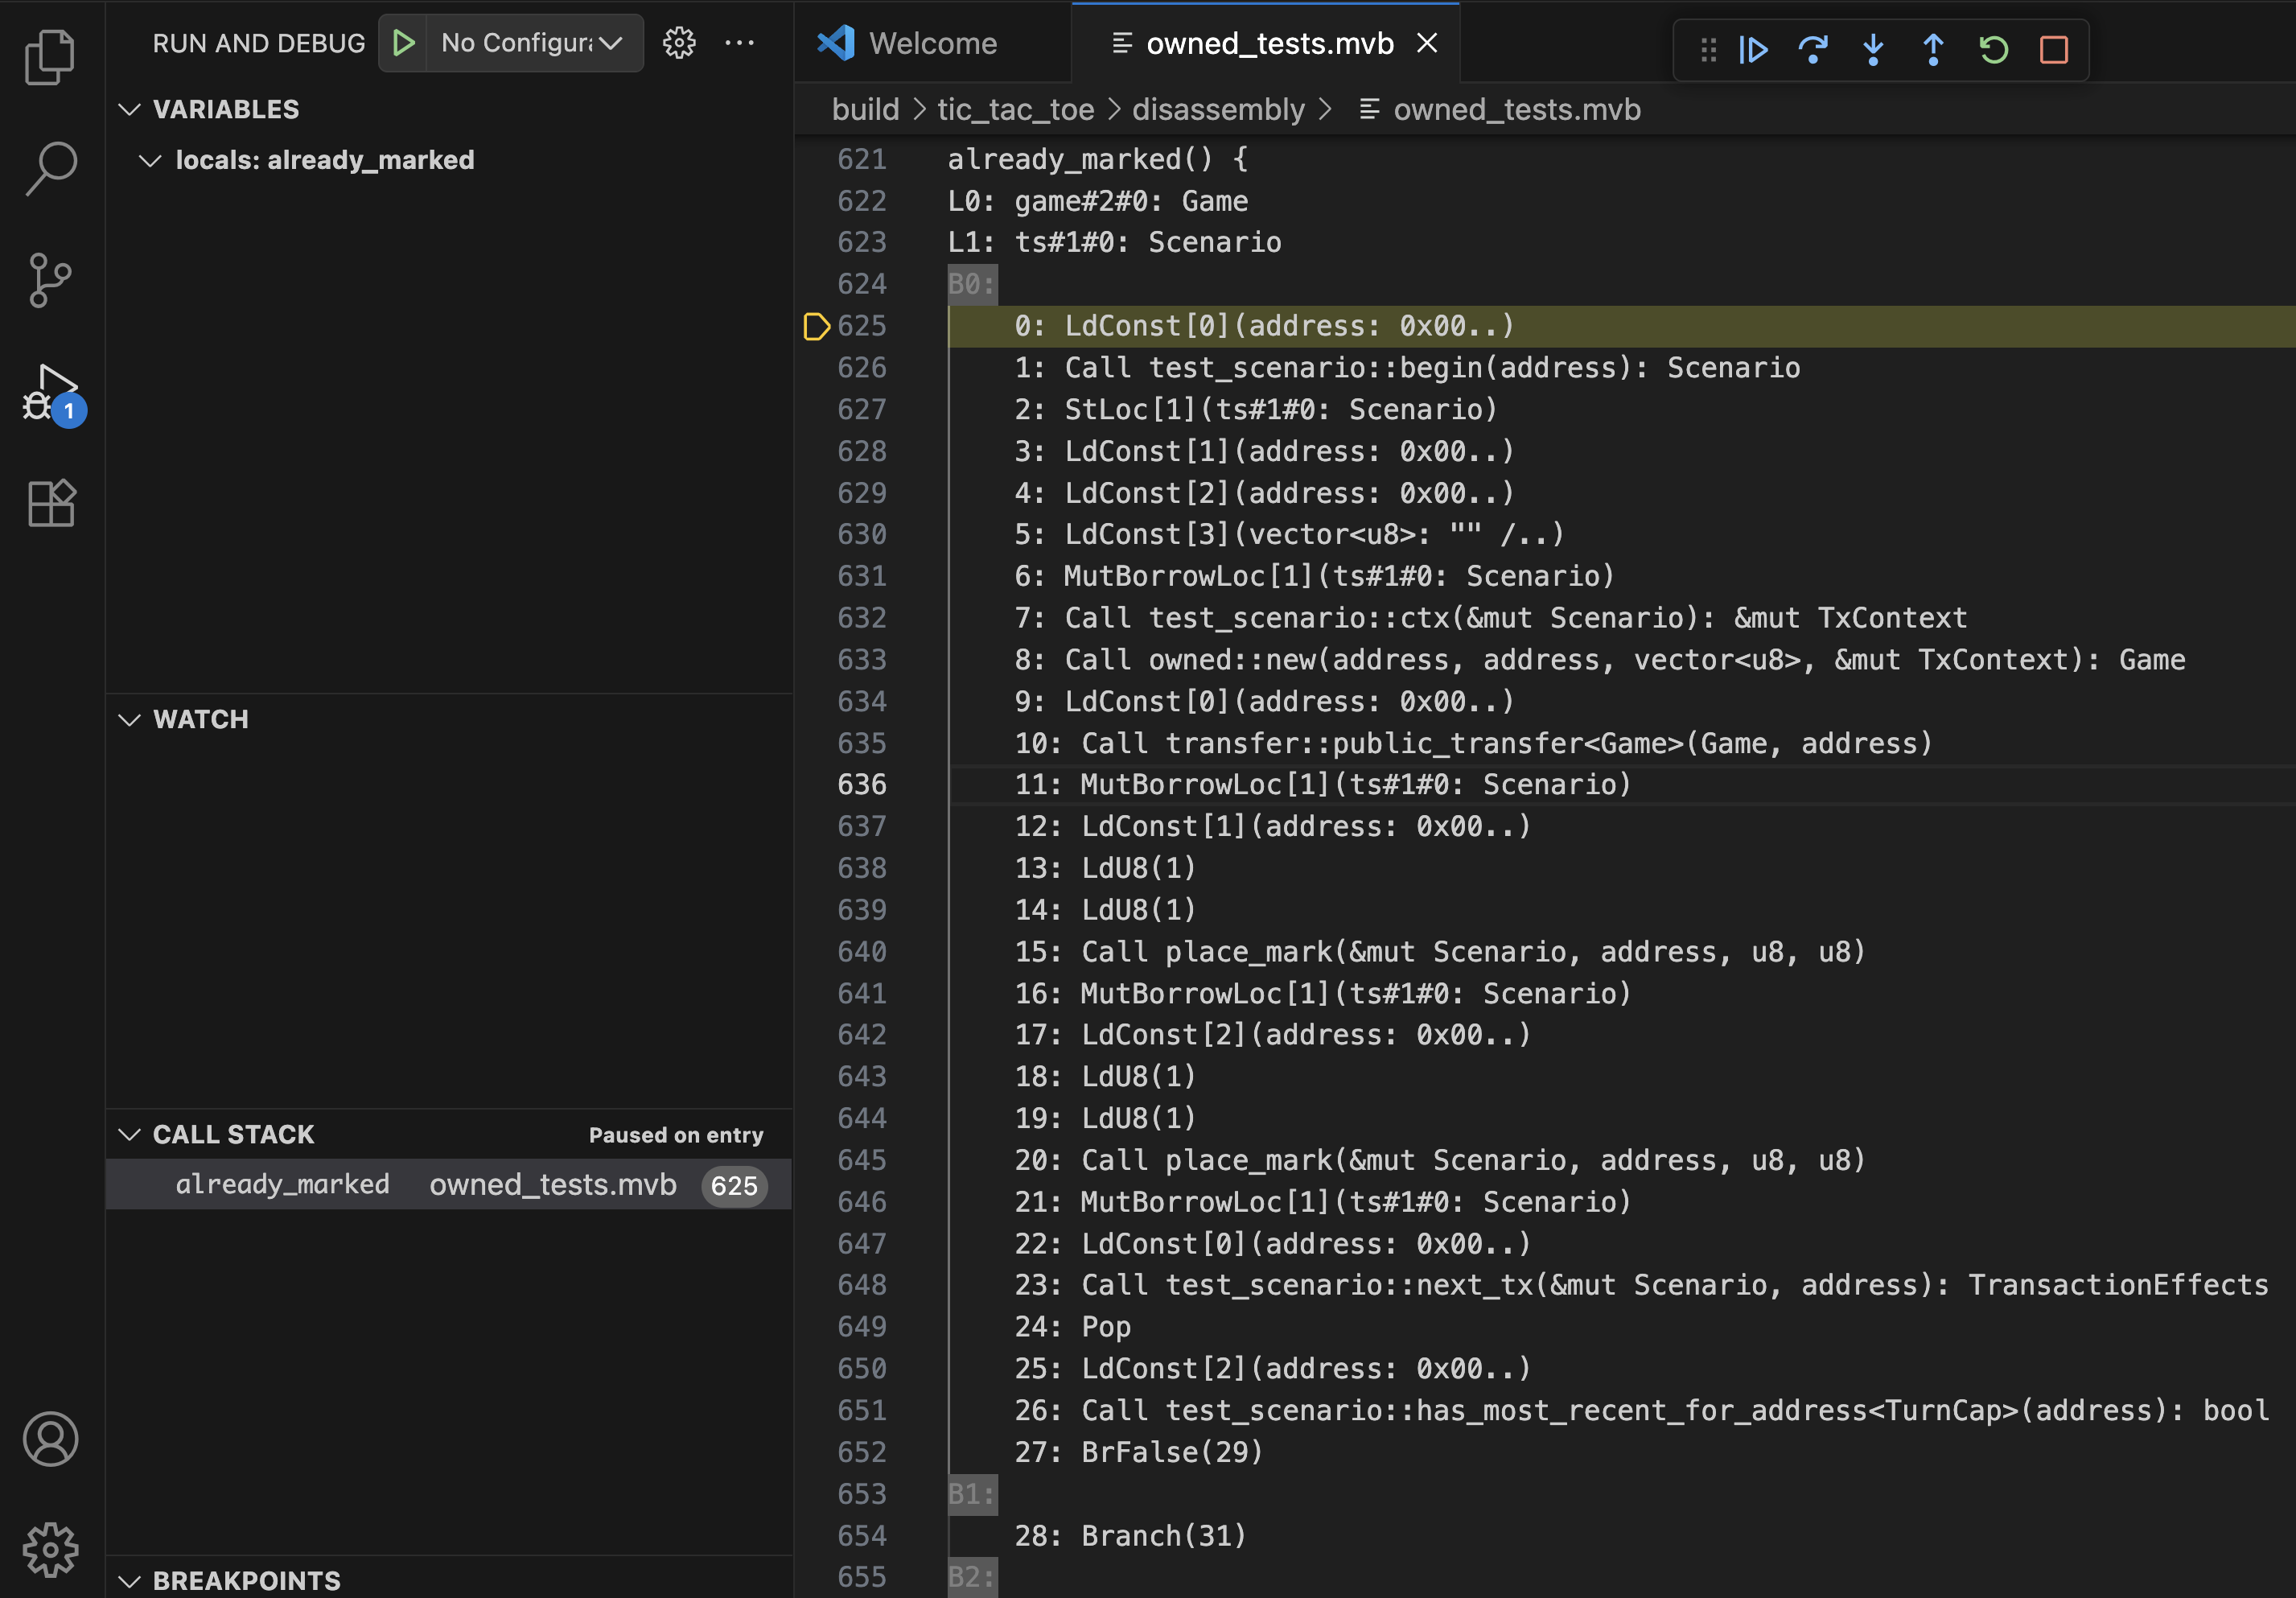
This is a lower level representation of the Move code that is still quite useful to improve one's understanding of the Move code behavior and execution flow. It also has one advantage over the source view: it is a much better match to what is recorded in the execution trace. In presence of Move compiler optimizations, disassembly view is the ultimate source of truth. For example, some variables present in the source may no longer be present in the trace, which you can verify in the disassembly view.
You can still provide source code for on-chain transactions by hand to enable source view. Support for automating source-level debugging for on-chain transactions will be available in the future.
If both source code and disassembled bytecode are available, you can toggle between source view and disassembly view via Move: Toggle source view and Move: Toggle disassembly view commands from the command palette. You can open these with Shift + ⌘ + P on macOS, Ctrl + Shift + P on Windows/Linux).
Stepping through code execution
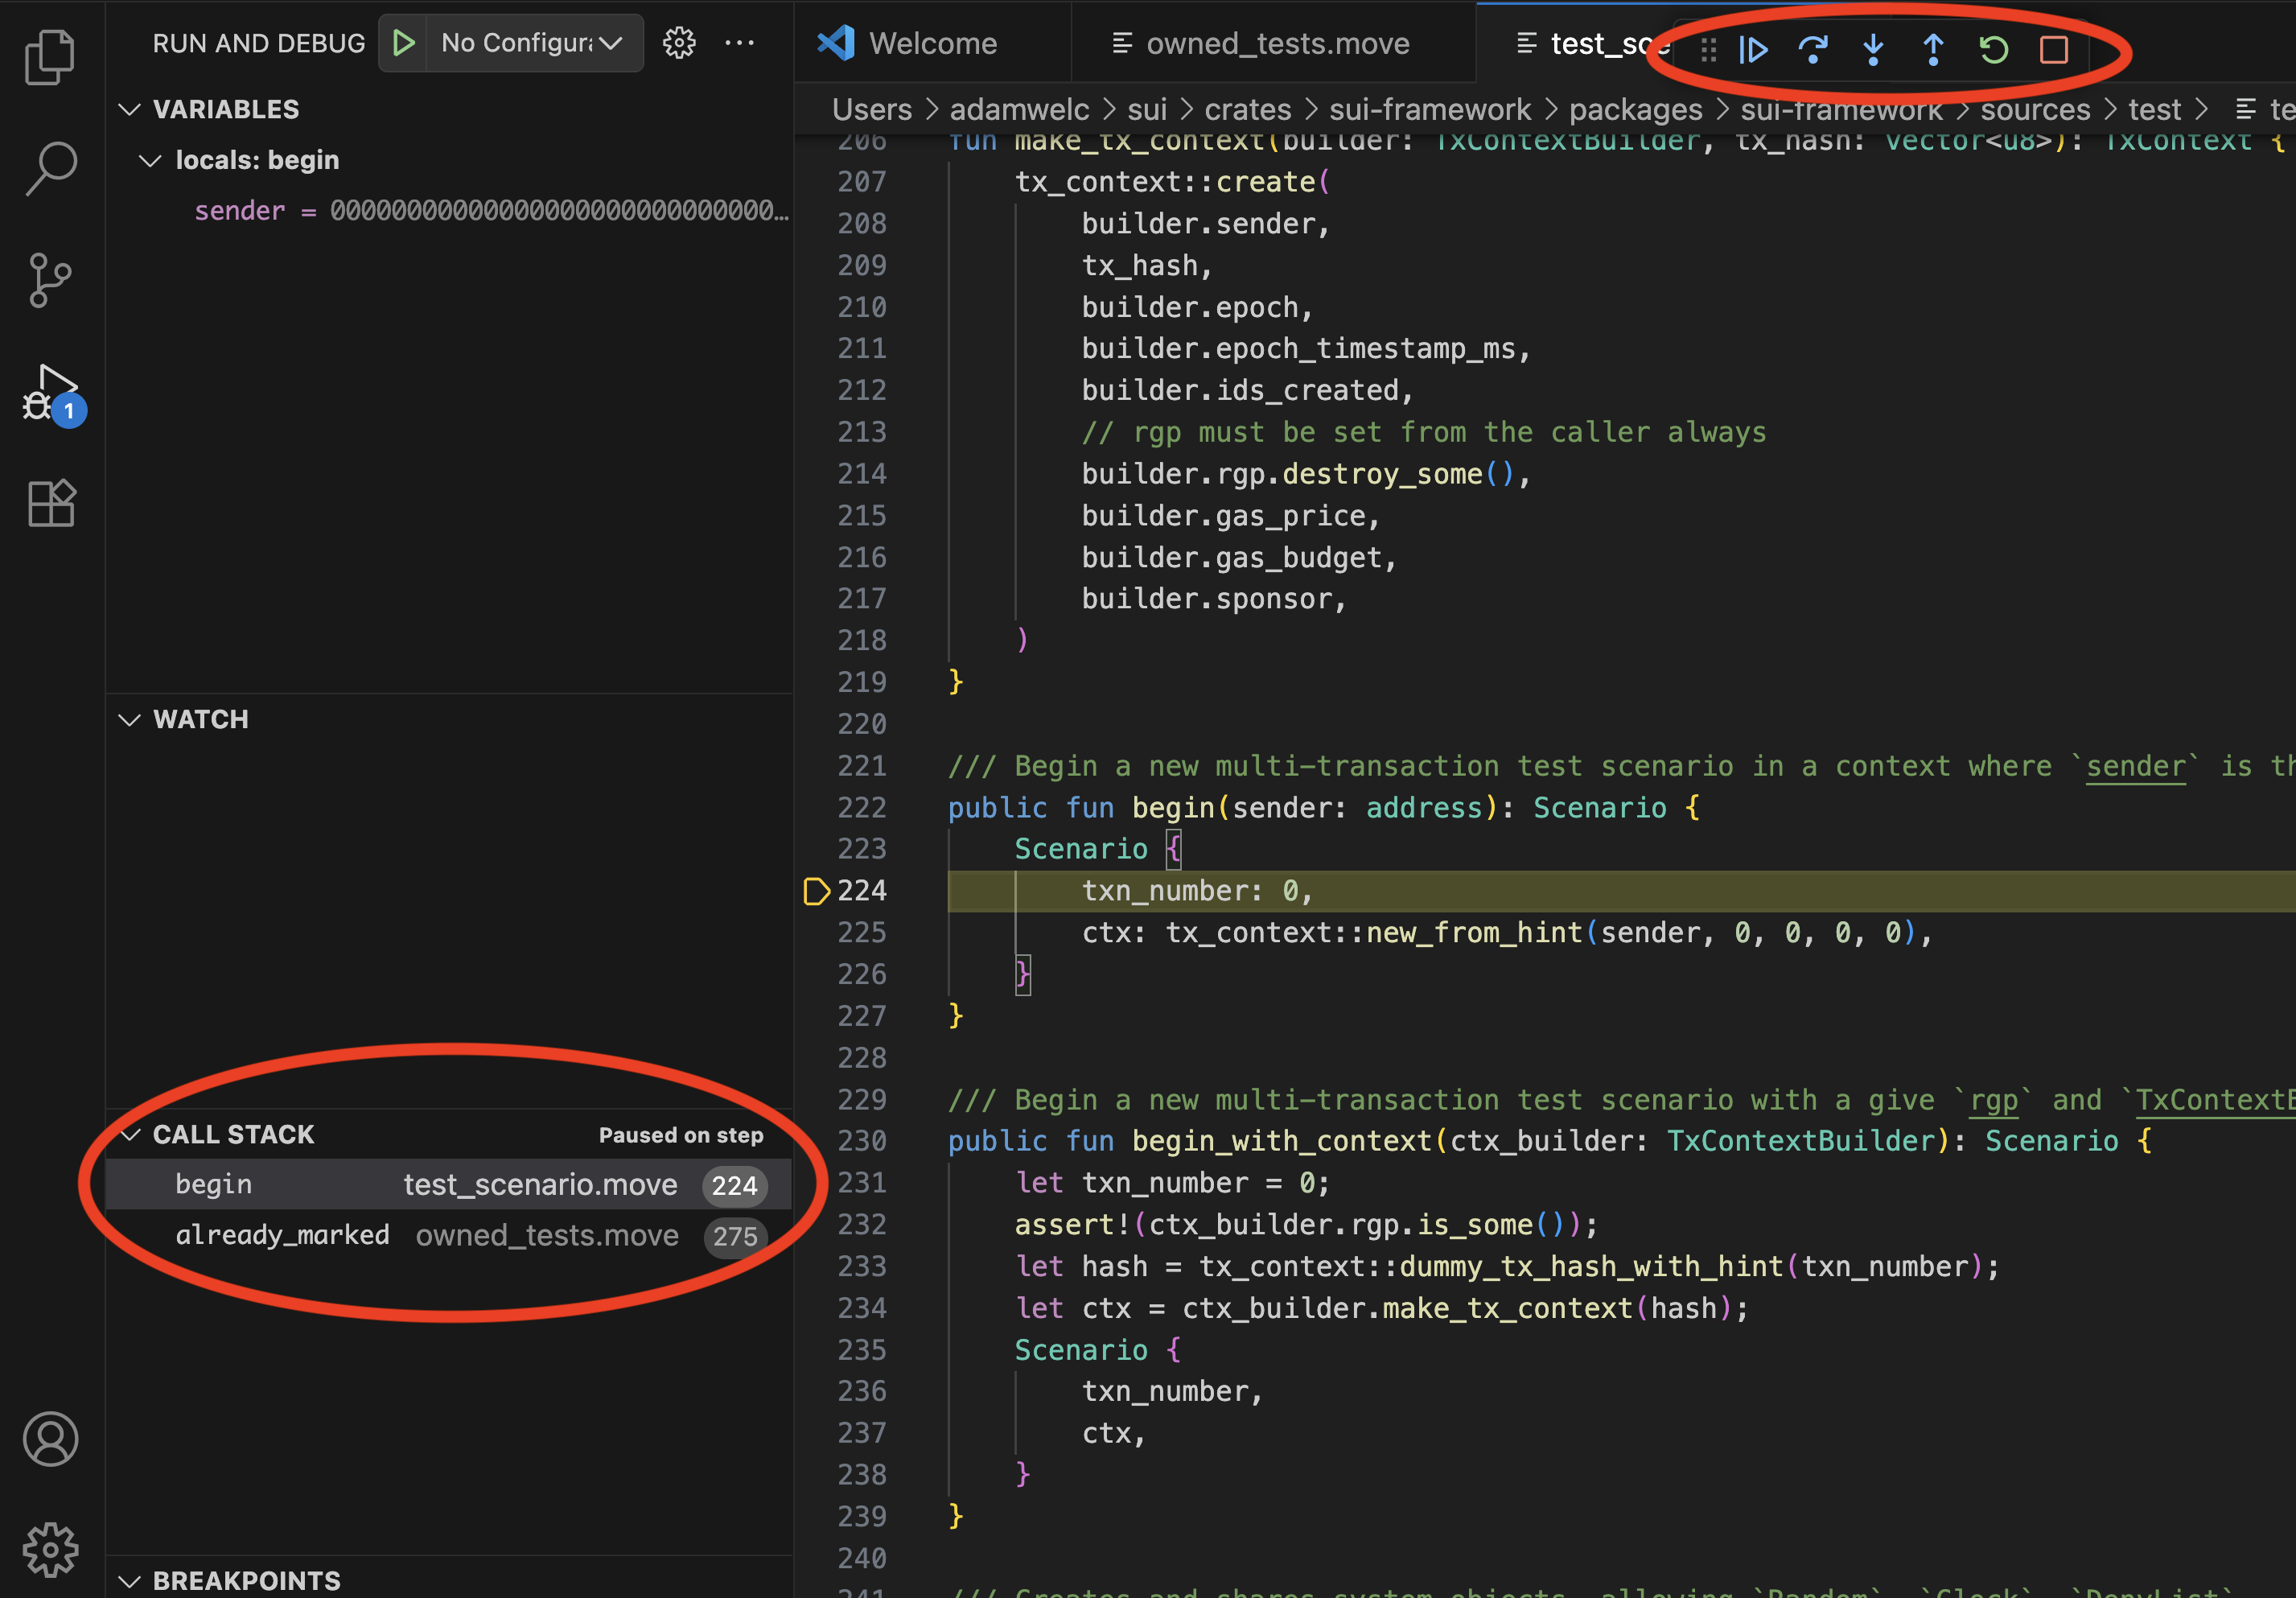
Move Trace Debugger supports the following standard debug actions:
- Step Over
- Step Into
- Step Out
- Continue
- Restart
- Stop
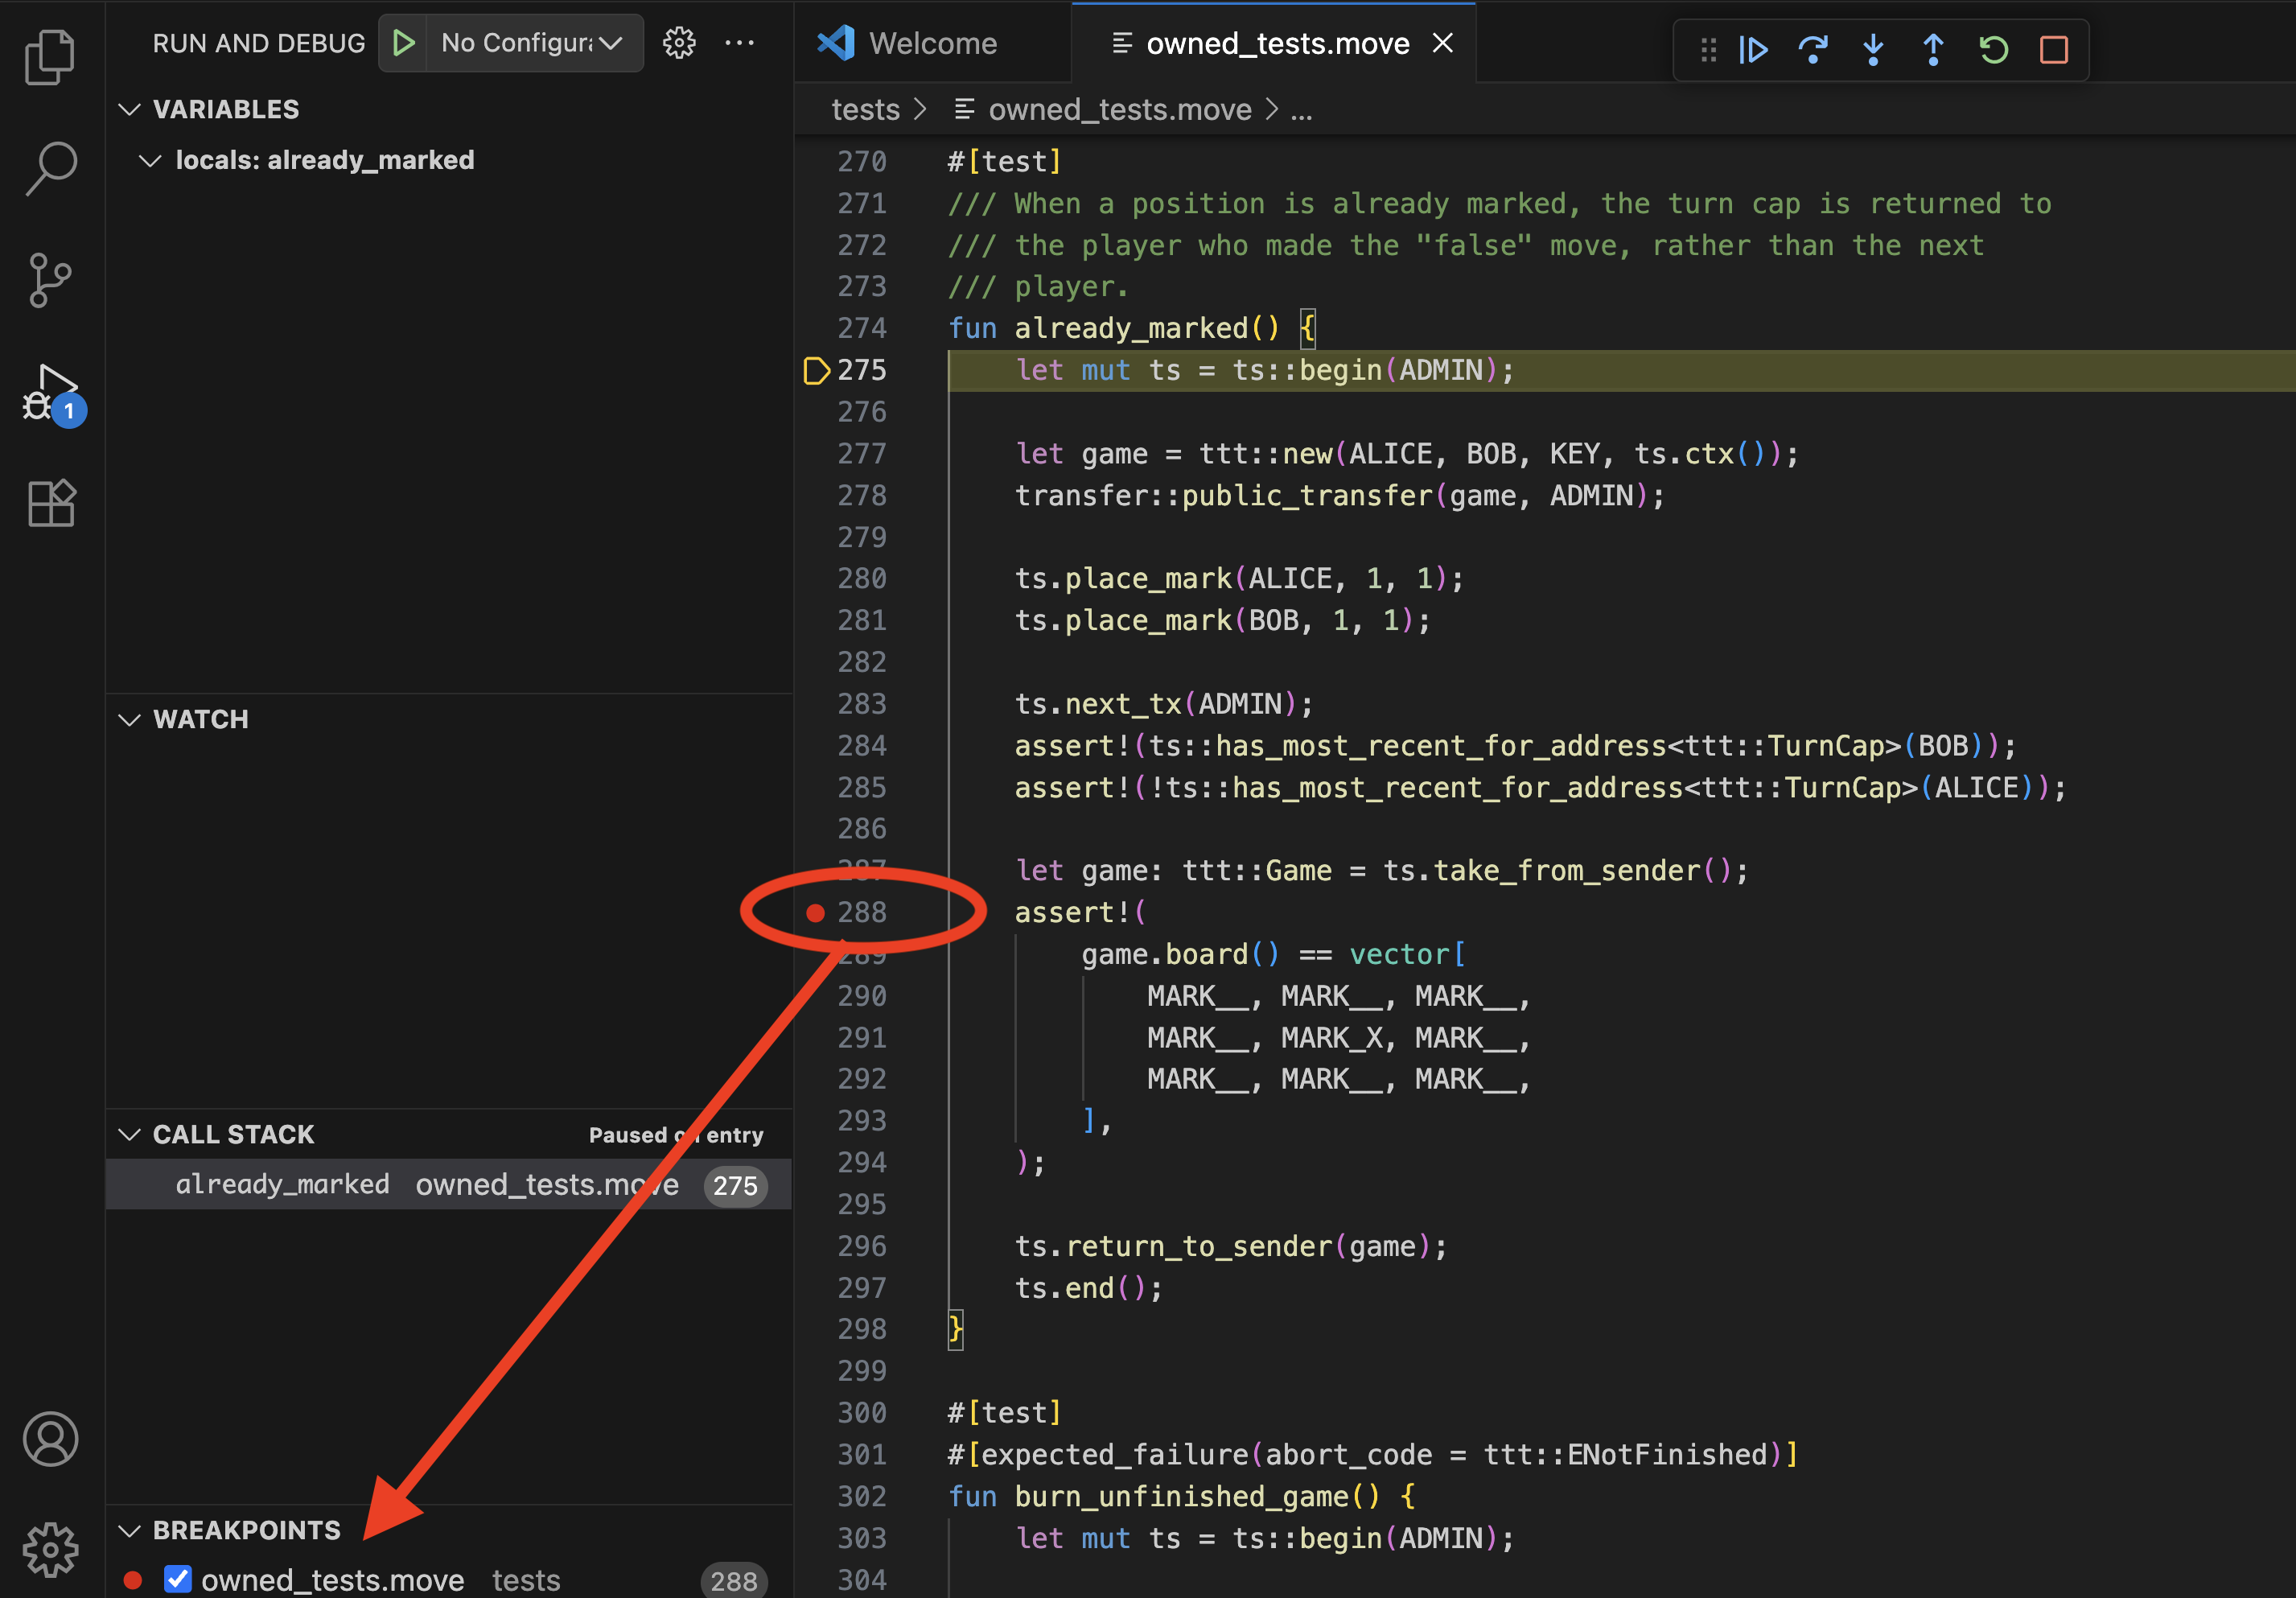
As you step through the code into other function calls, the resulting call stack view in the left-hand side bar will update.
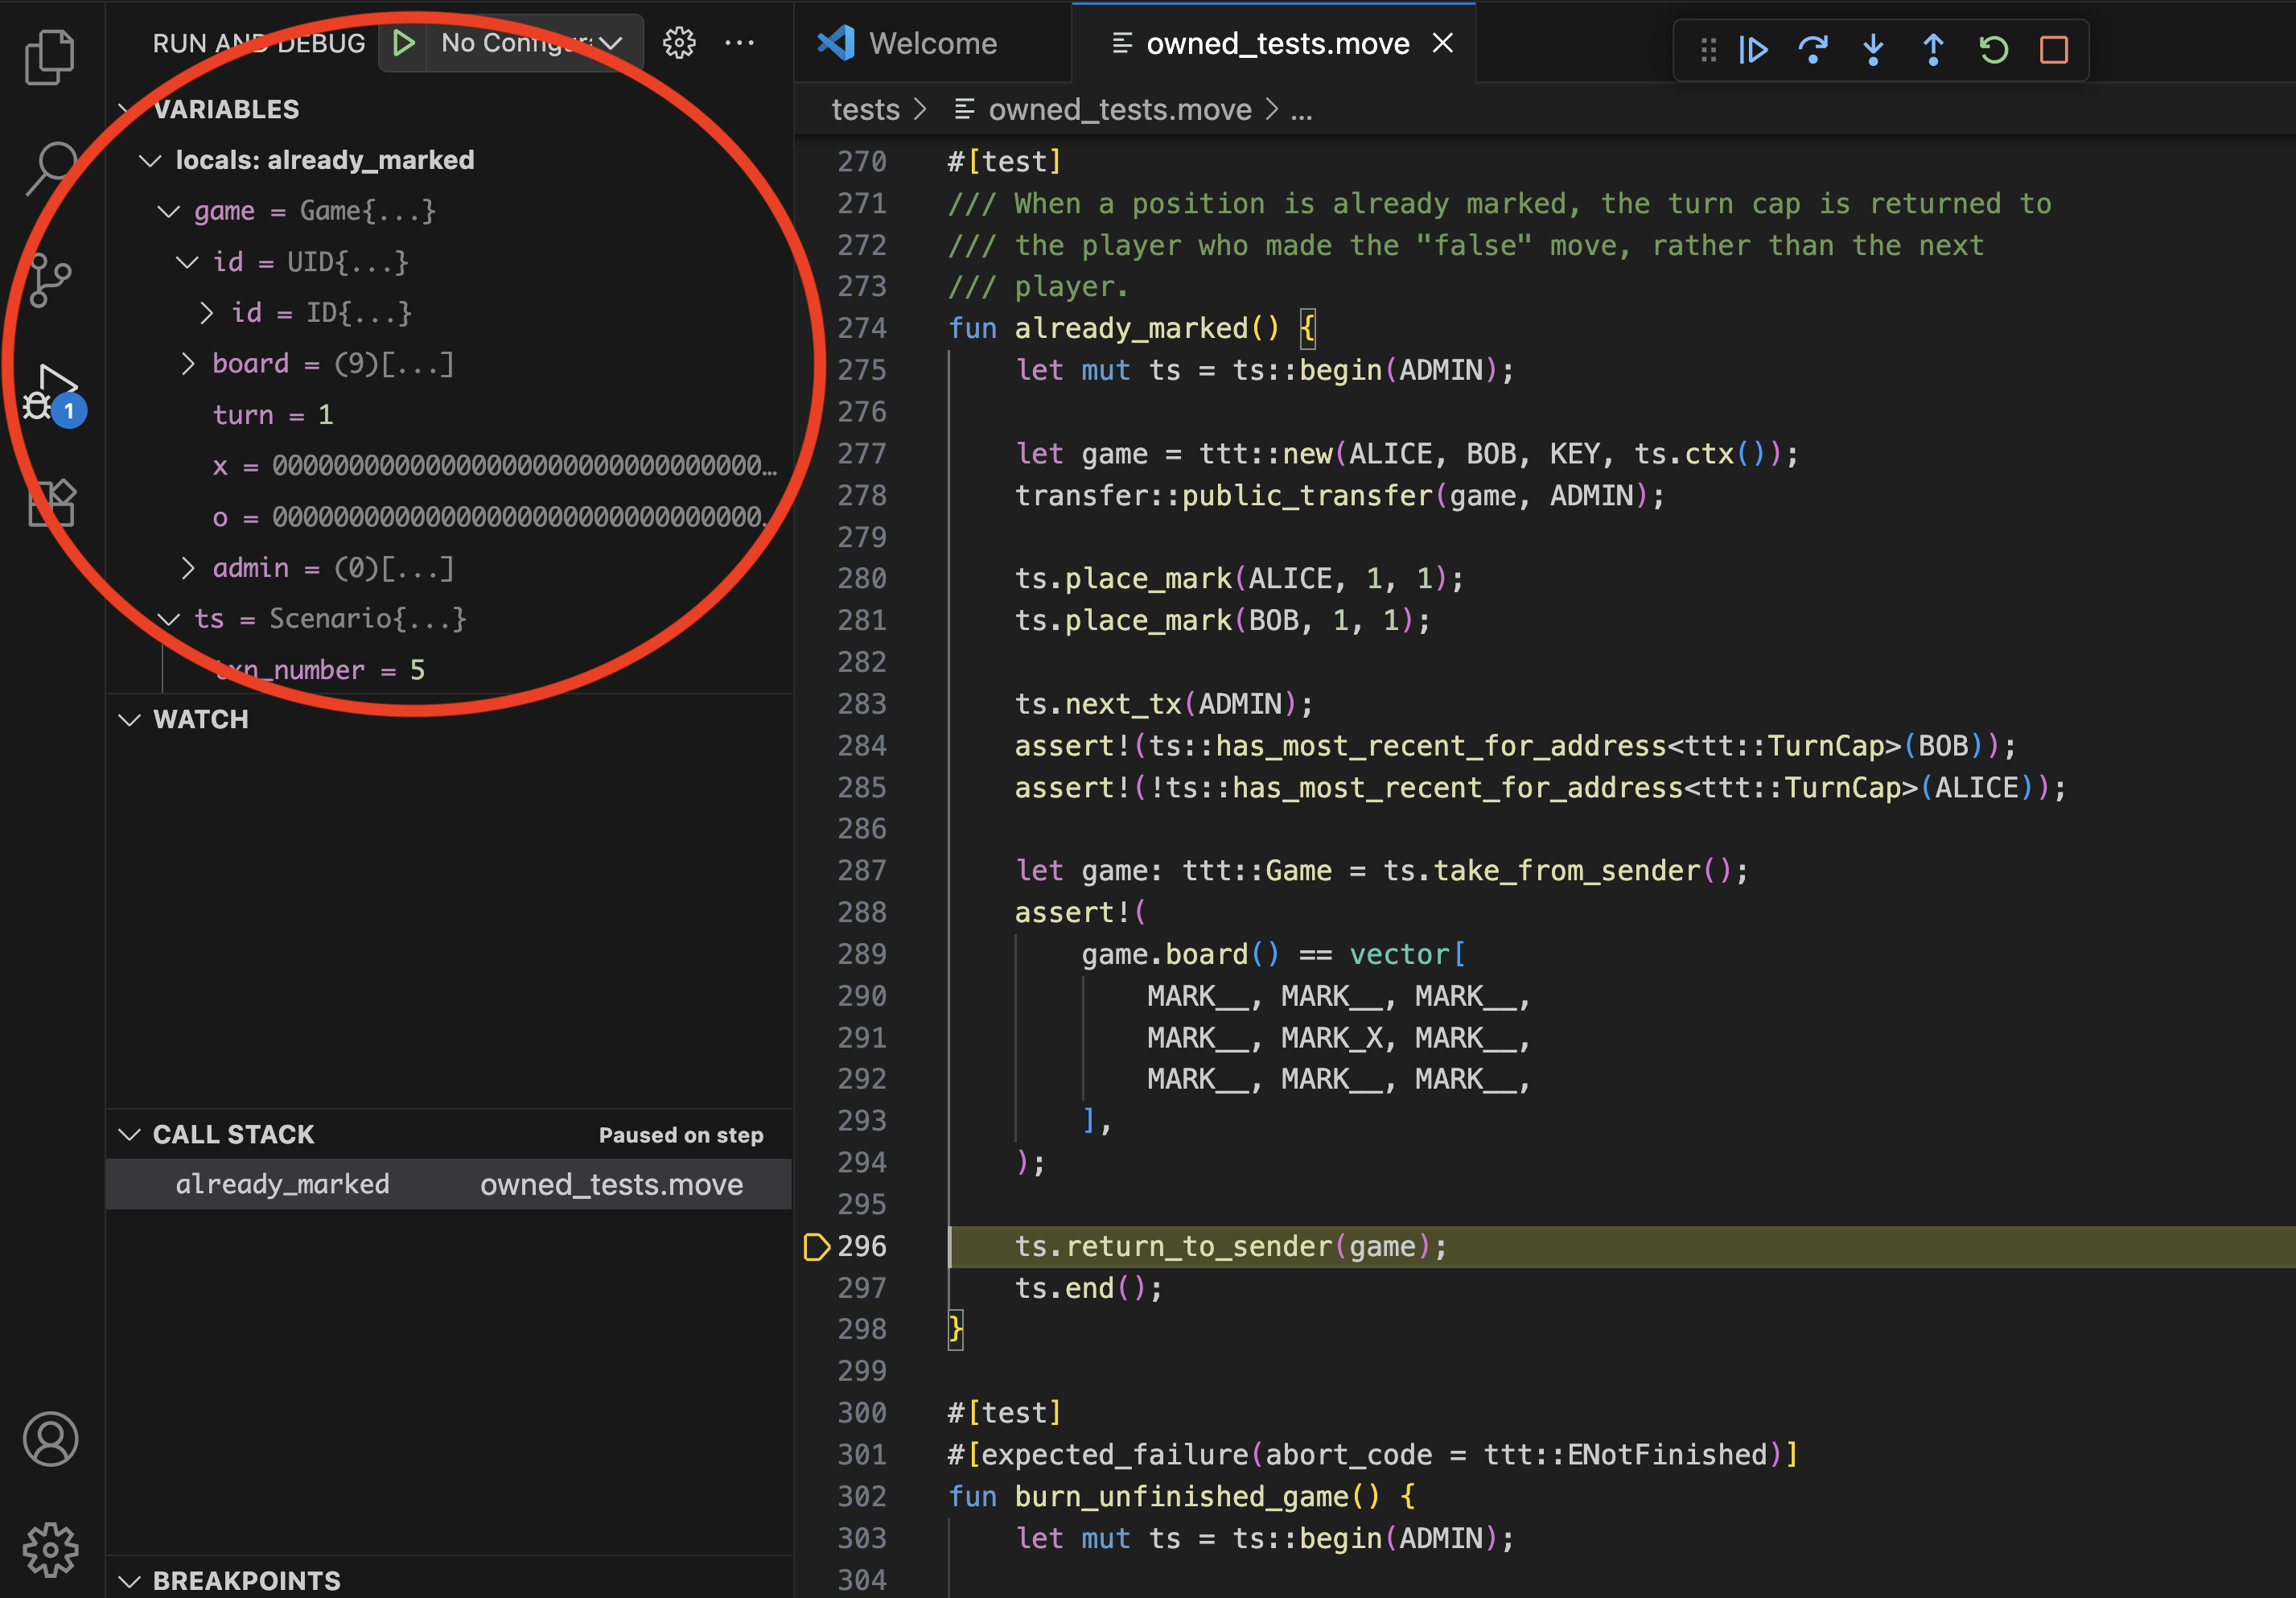
Tracking variable values
Move Trace Debugger supports displaying values of primitive types, Move structs, and references. Note that some of the variables present in the source code can be optimized away by the Move compiler and are not available in the underlying trace. Consequently, their values cannot be tracked by the debugger.
The debugger currently does not support setting watch points on variables.
Line breakpoints
Set line breakpoints in your code by placing a cursor on any given line and choosing Run -> Toggle Breakpoint from the main menu. You can use the Continue debug command to advance execution to the next breakpoint.
PTB debugging features
When debugging PTBs, the debugger first displays a summary of the PTB structure. In the following example, you can see that the PTB being debugged consists of multiple Move calls and several native PTB commands (Split Coins, Merge Coins, and Transfer Objects).
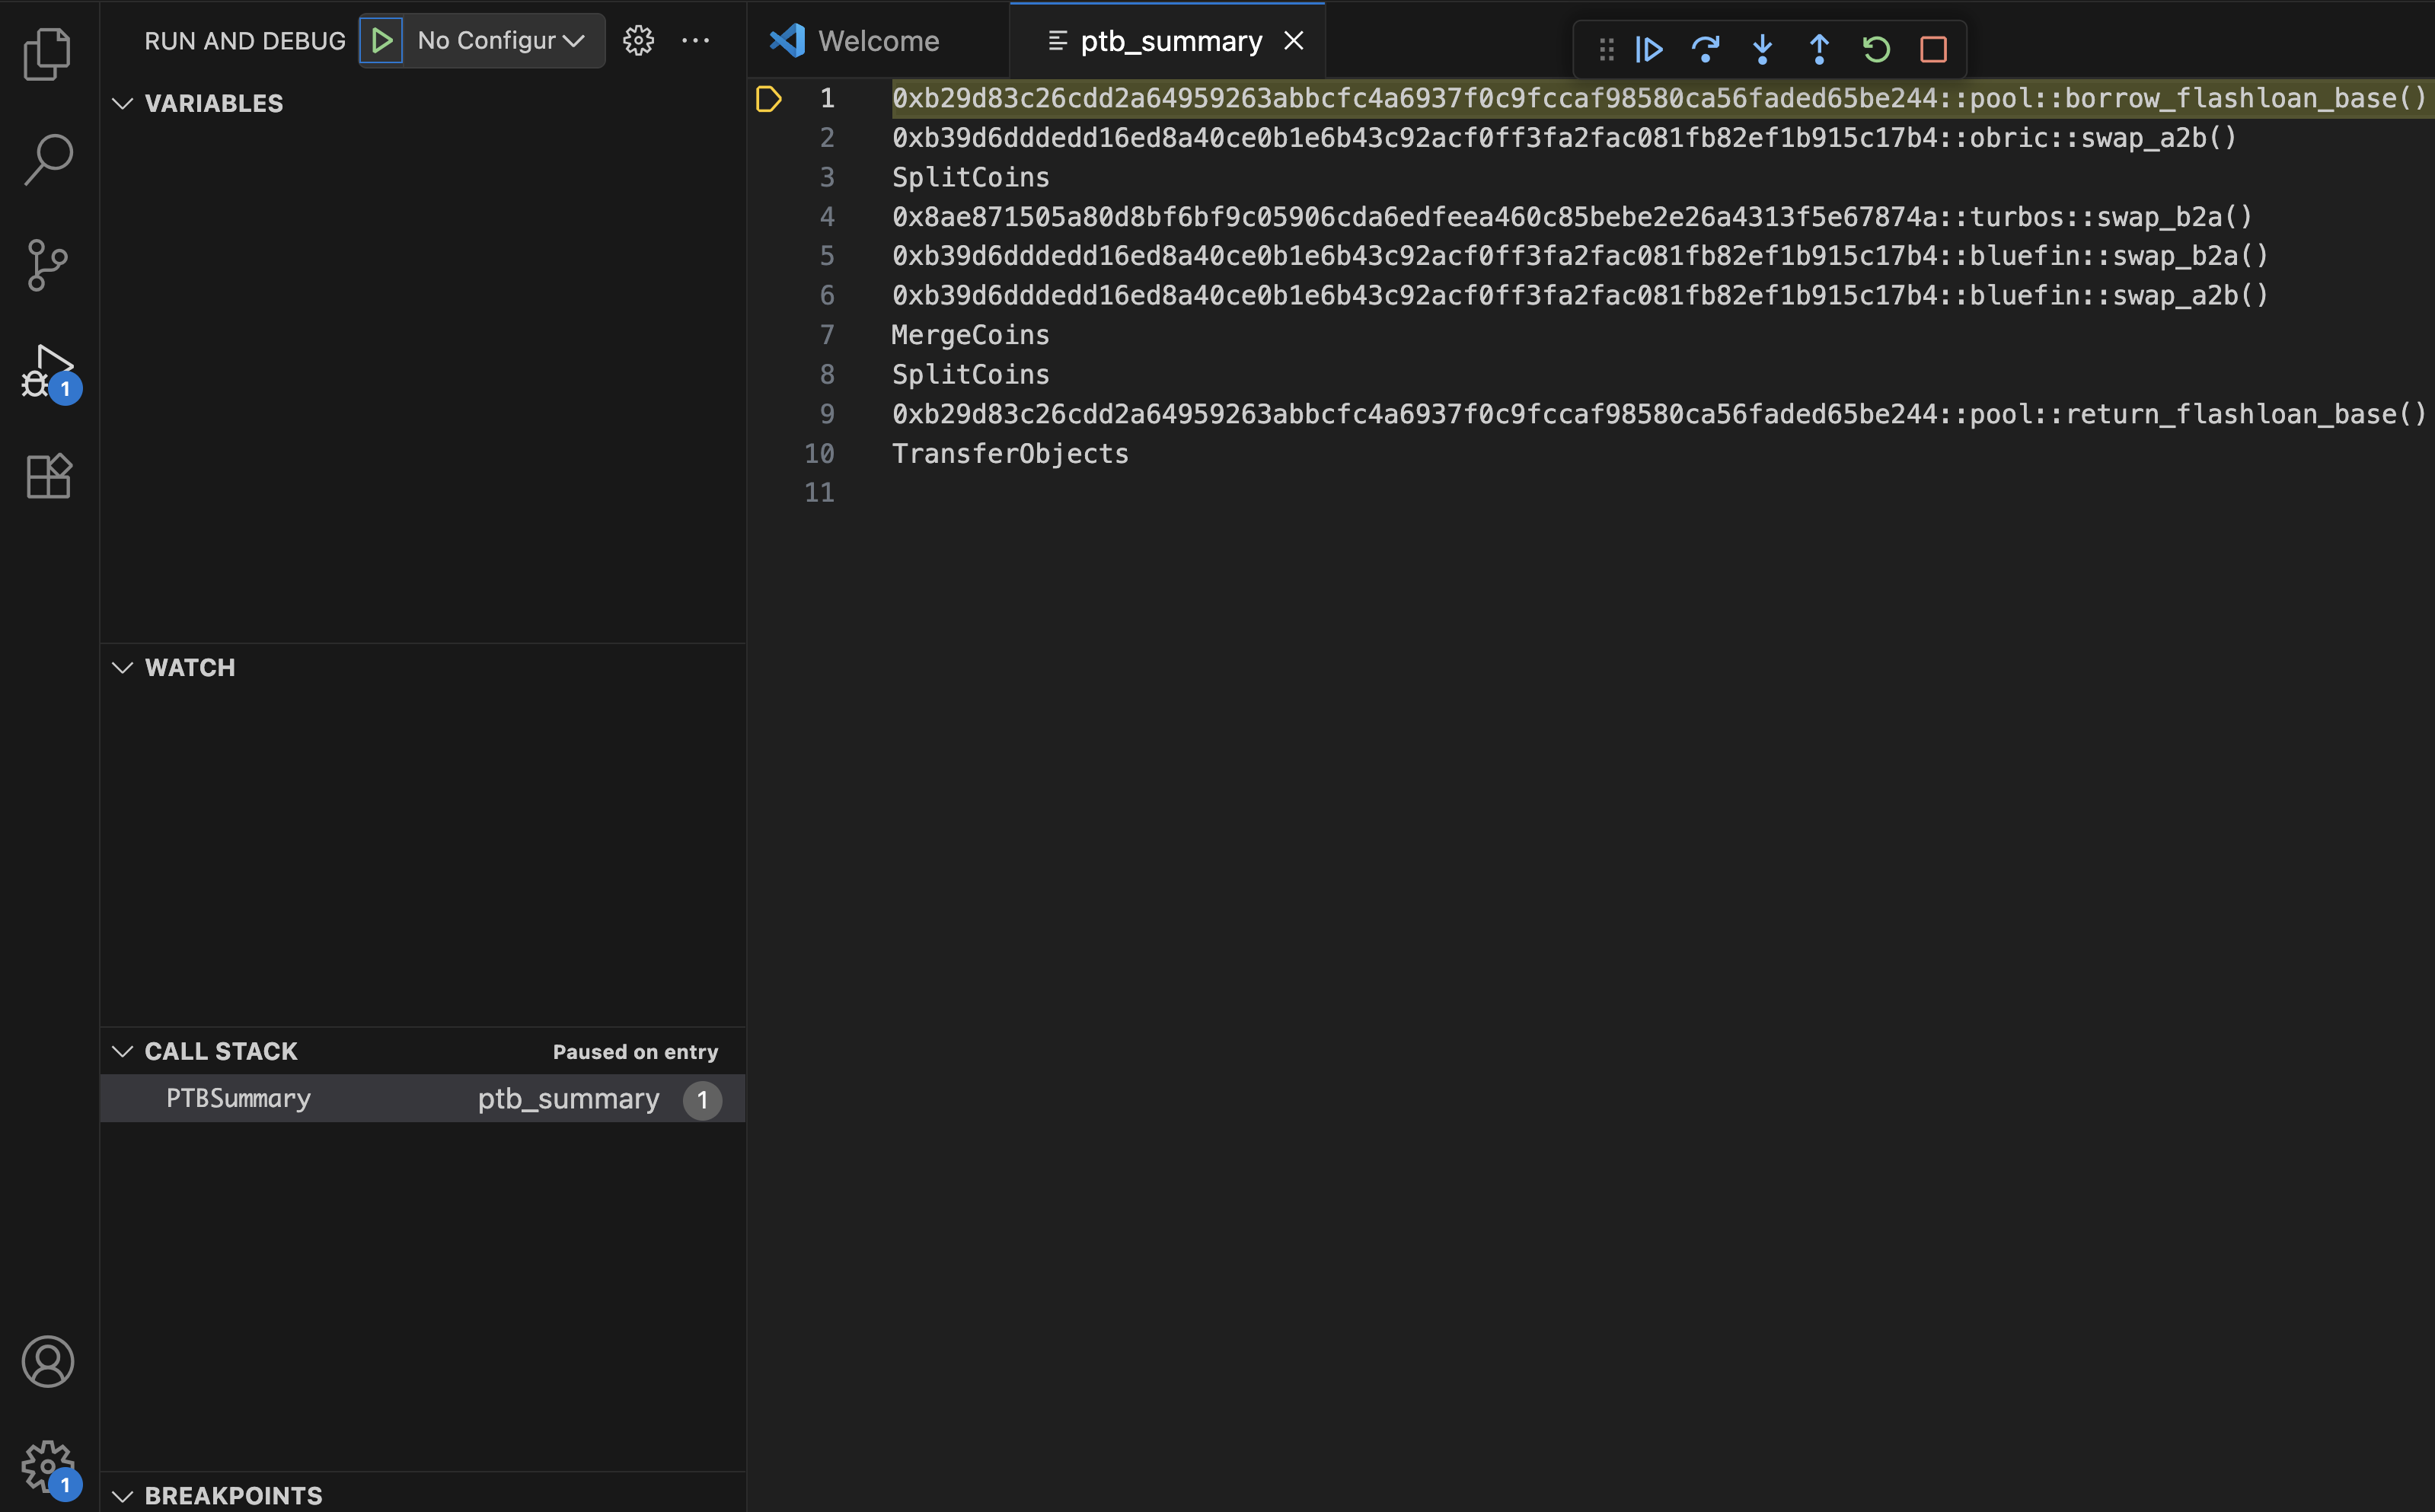
In the PTB summary, you can step into specific commands or step over them, much like stepping into functions and and stepping over them when debugging Move code. Setting breakpoints in the PTB summary view is not currently supported.
Stepping into a Move function starts Move code debugging with all the relevant features available (value tracking, breakpoints, etc.).
Stepping into a native command allows you to inspect its input and result values.
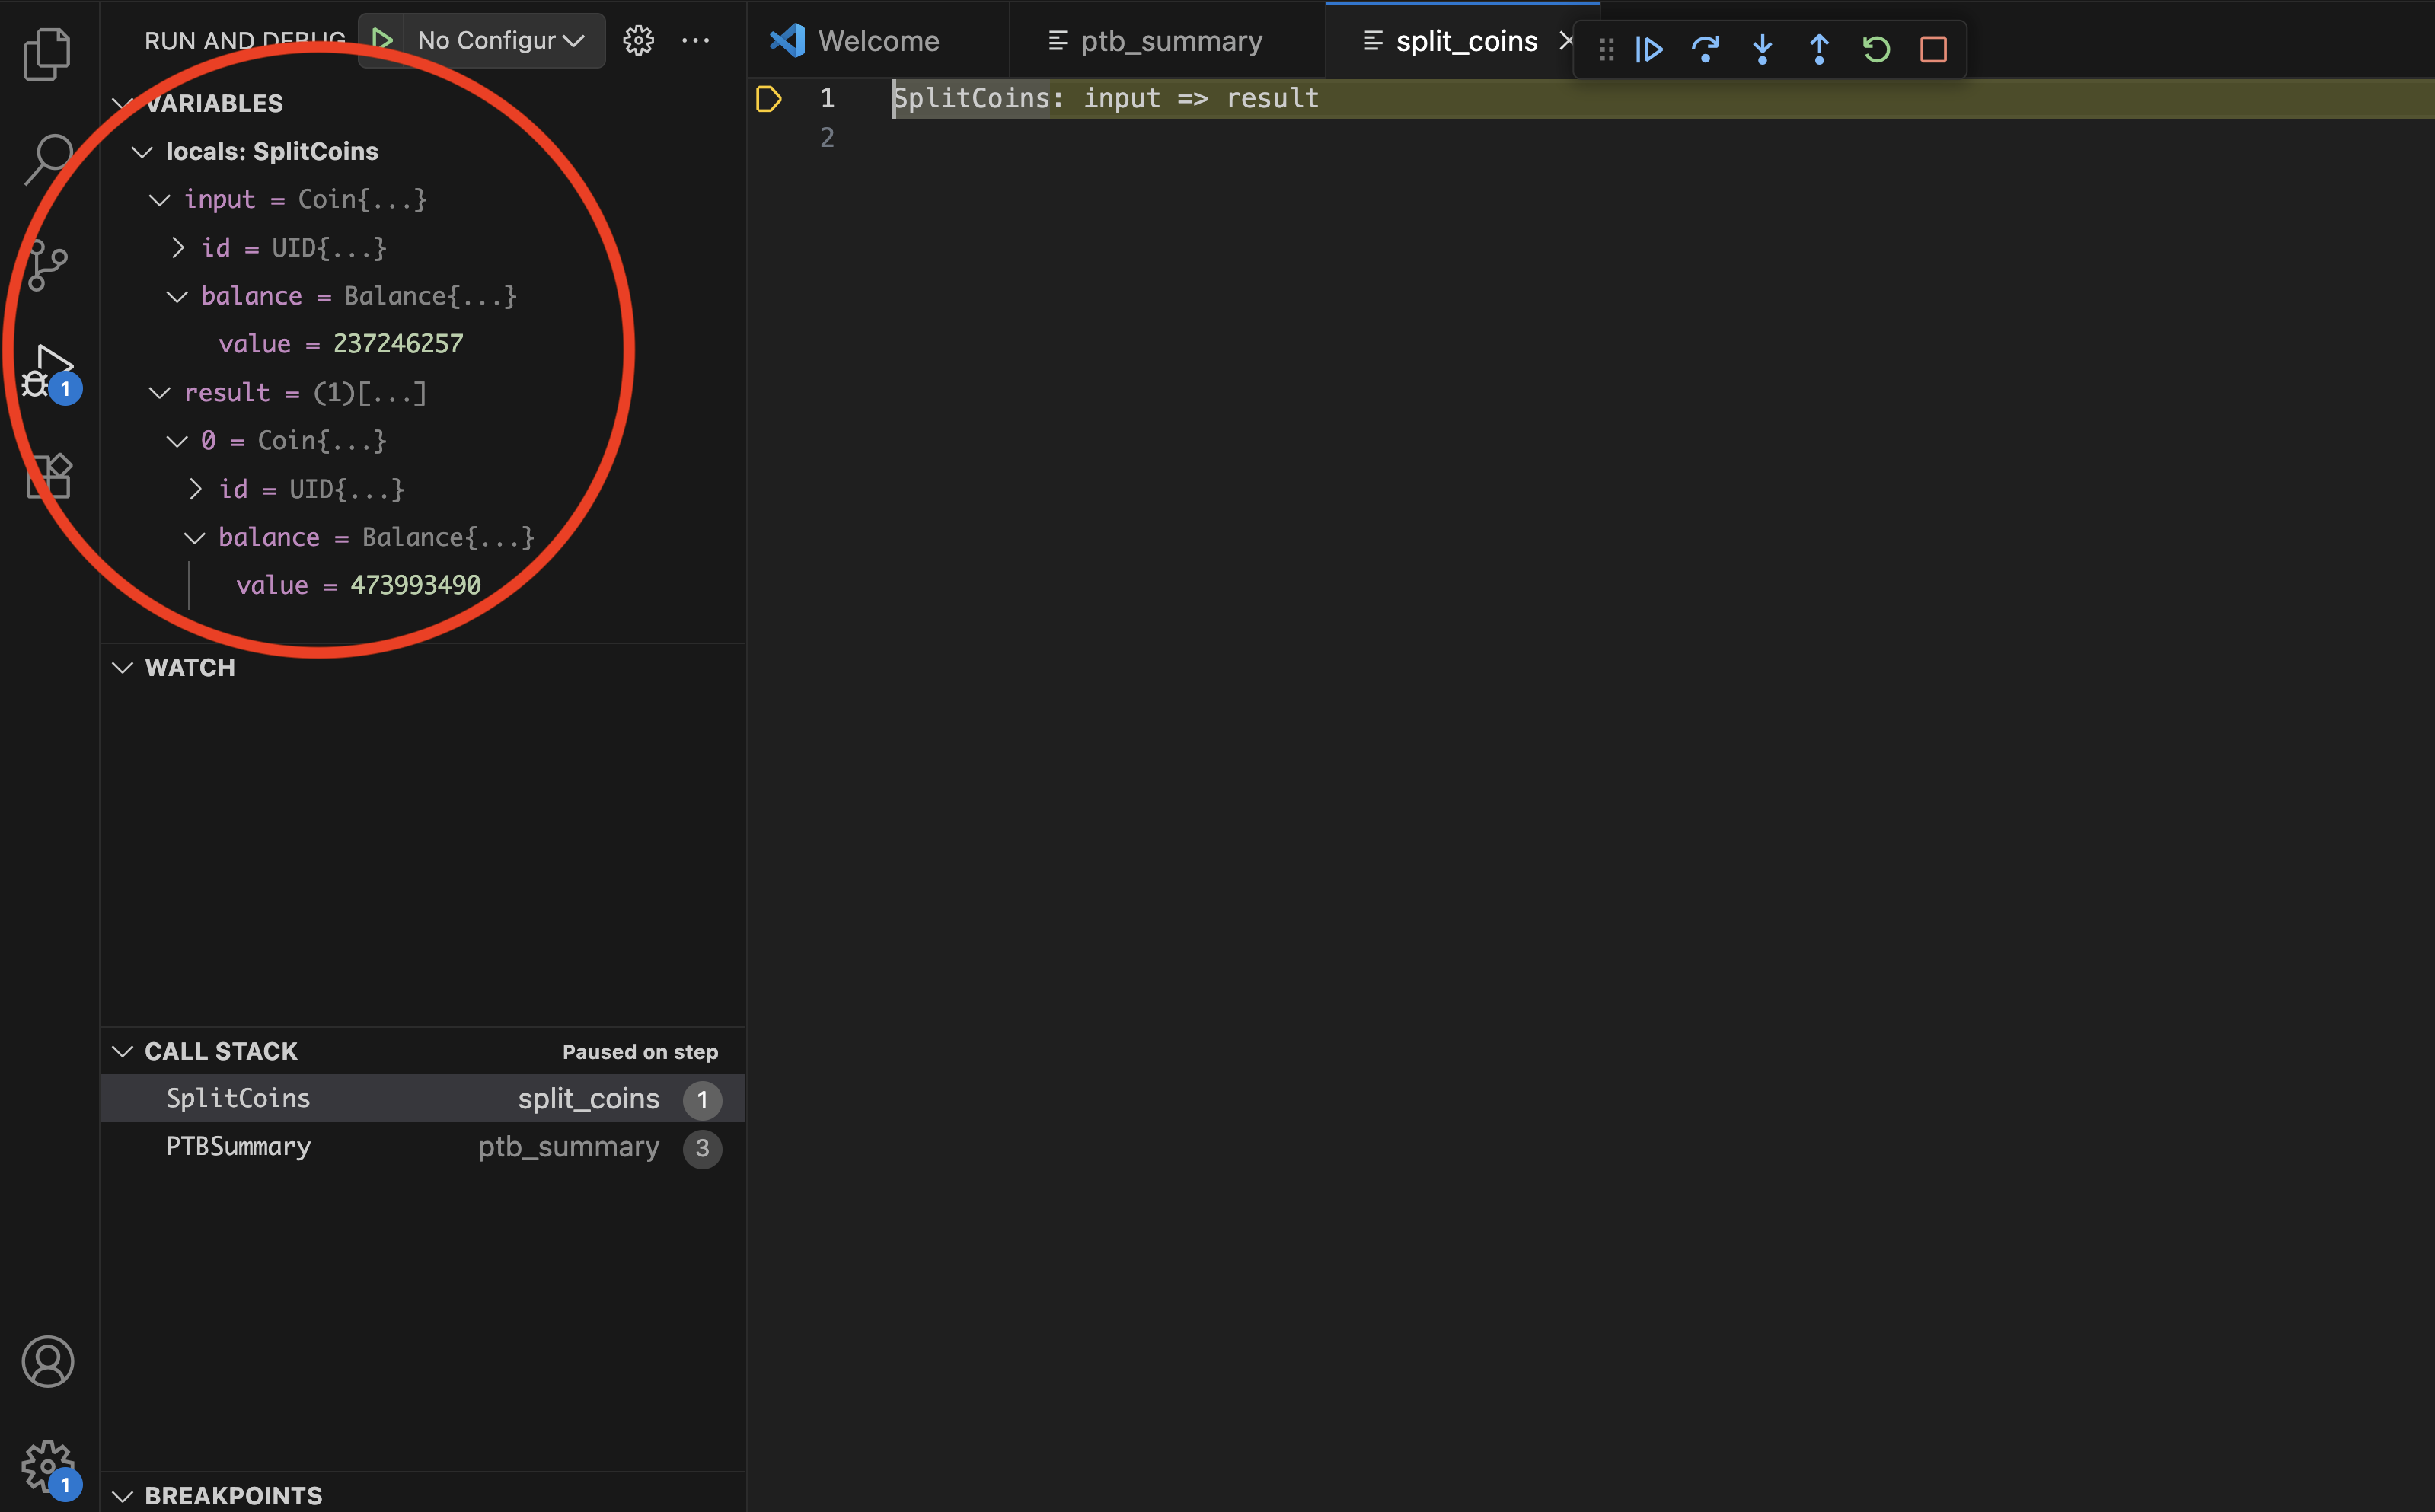
There is no stepping "through" native commands. Once the state is inspected, you can only step out of it or keep stepping to move to the next command.
Usage
Use the debugger to debug unit tests and existing on-chain transactions (including PTB debugging support) with the help of of the replay tool.
Debugging unit tests
Debugging a Move unit test is a two-step process:
1. Generate execution traces
-
Open the command palette (Shift + ⌘ + P on macOS, Ctrl + Shift + P on Windows/Linux).
-
Run the
Move: Trace Move test executioncommand.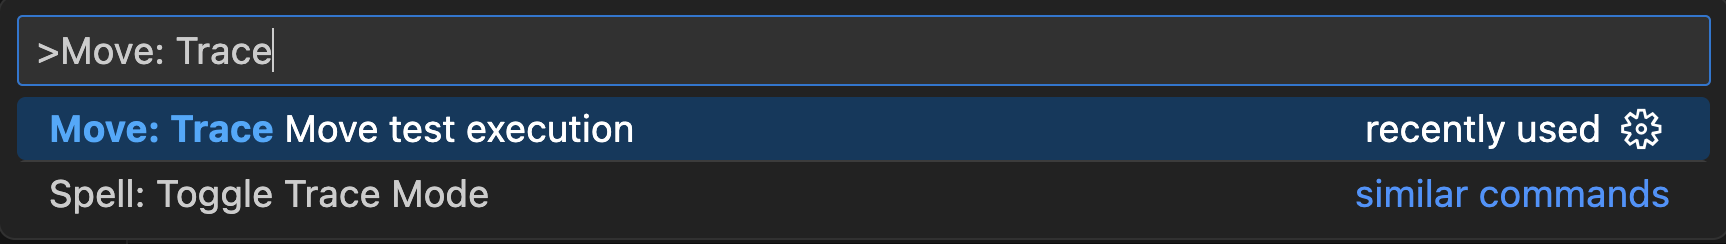 info
infoThis command uses the
suibinary under the hood which needs to be pre-installed. The location of the binary needs to be discoverable by the Move extension. -
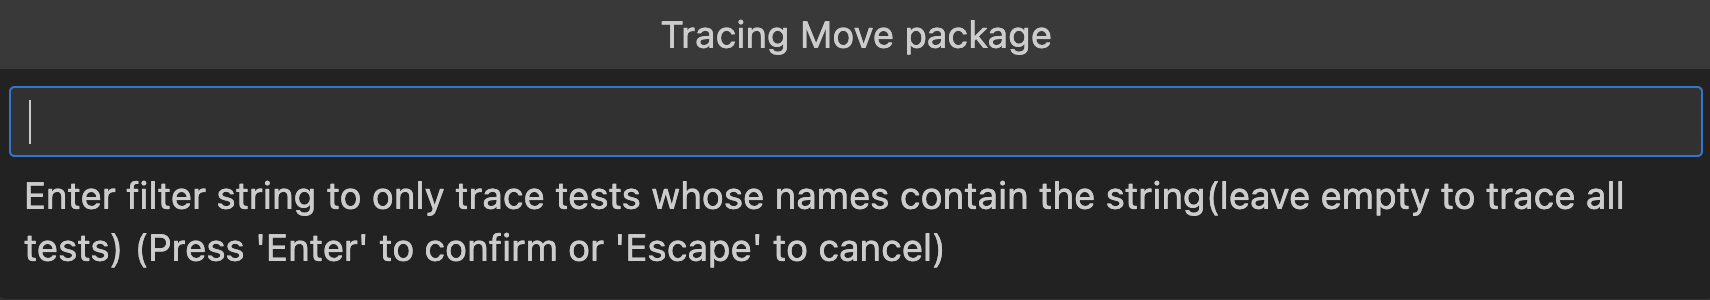
The extension displays a filter prompt. Either type a filter string to target specific tests or leave the field blank to run all tests and press Enter.
-
Find the generated traces in the
tracesdirectory.infoIf trace generation in the Visual Studio Code extension does not work for some reason, you can generate traces by executing tests for your package using additional flags:
sui move test --trace-execution --disassemble
2. Start debugging
-
Open the Move file containing your test.
-
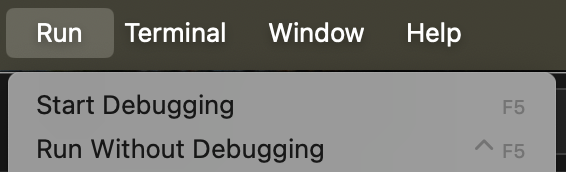
Select Run -> Start Debugging from the main menu.
-
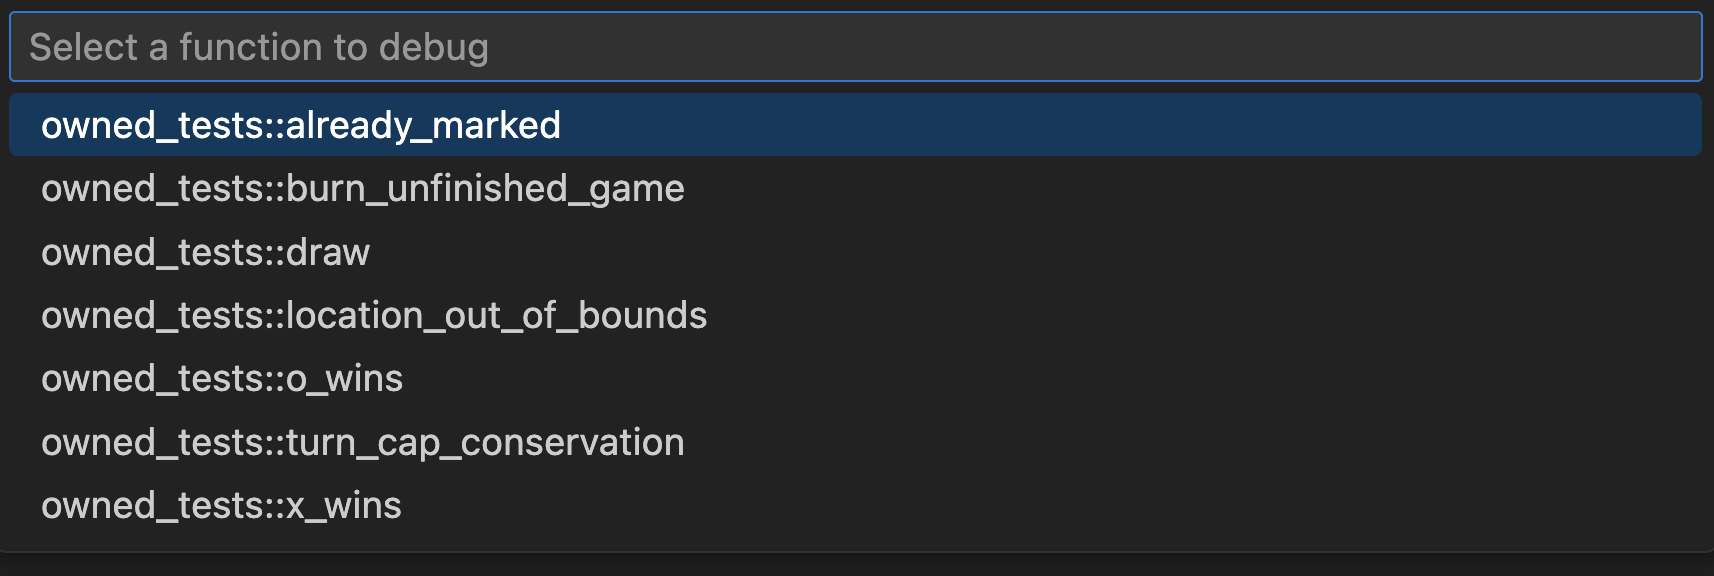
If the file has multiple tests, select the specific test from the dropdown menu.
Debugging on-chain transactions
Debugging an on-chain transaction is a two-step process:
1. Generate execution trace
You need to know a transaction's digest to generate a trace for it. For example, 0x42.
sui replay --trace --digest 0x42
This command re-executes the transaction locally, generates a trace of its execution, and downloads all data required for debugging this transaction. Data is deposited in a subdirectory of replay tool's output directory (.replay by default, but its location is configurable). This subdirectory is named after the transaction digest.
2. Start debugging
-
Open the subdirectory containing the transaction data downloaded for a transaction with the given digest. Open the trace file
trace.json.zst.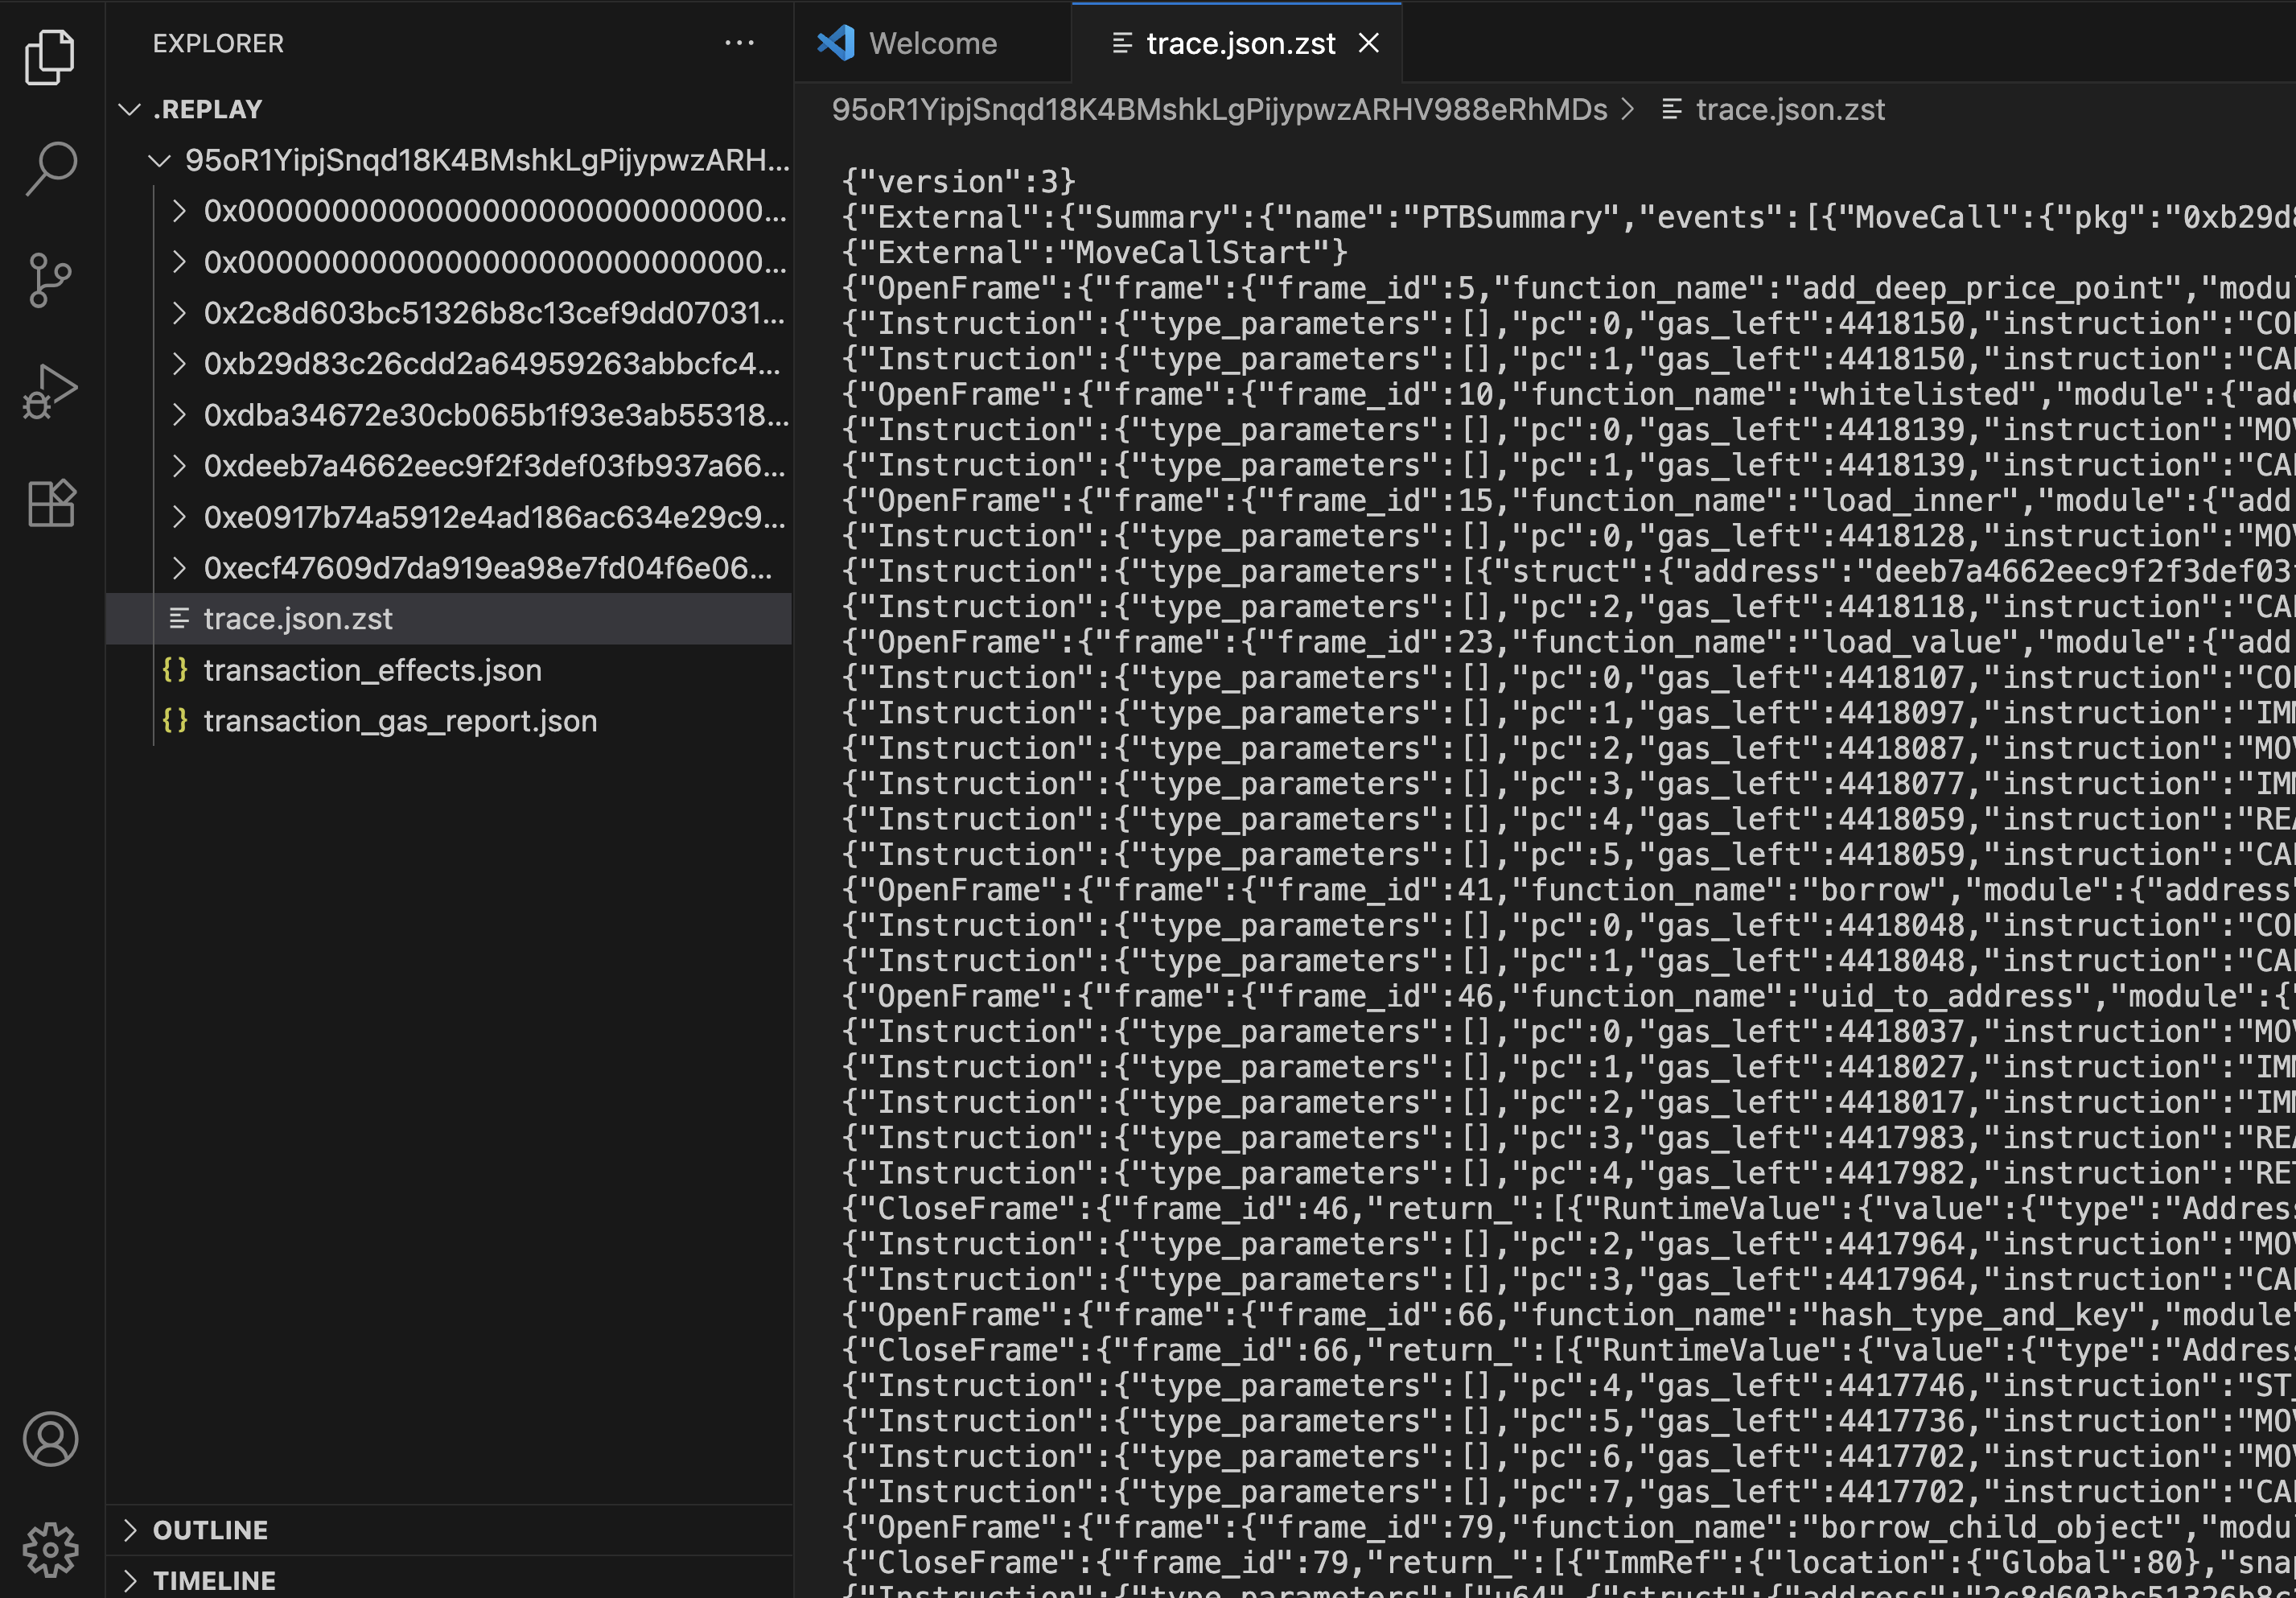
-
Select Run -> Start Debugging from the main menu.
infoThe first time you run this command you may be asked to select a debugger type. Select Move Debugger.
Source-level debugging for on-chain transactions
Data downloaded from the network for debugging a transaction does not contain the source code for Move calls executed throughout the transaction. You can, however, provide the sources along with additional debugging metadata yourself to enable source-level debugging. If you have access to the source code of packages used throughout the transaction, you can build the packages to generate the debugging metadata and make the location of this data visible to the replay tool.
The source code version of each package should be the same version that was used to build the package used in the transaction. Otherwise, a discrepancy between execution trace (generated from on-chain data) and package debugging metadata (generated locally), might result in debugging failures.
For example, consider a situation when an on-chain transaction executes a call to some public function foo which then calls some private function bar. The package's source code used to generate the debugging metadata still has public function foo but foo not longer calls bar. When attempting to do source-level debugging in such case, if a call to bar was part of the execution trace, the debugger would have no source for function bar to display when the call is reached during the debugging session.
Using the newest version of a package might still work, particularly for packages whose existing functionality is largely stabilized and its source code rarely changes, such as Sui framework package. Below are the instructions on how to handle this simplified case, followed by instructions on how to locate precise versions of packages.
Consider the following: a mainnet transaction and with the digest 95oR1YipjSnqd18K4BMshkLgPijypwzARHV988eRhMDs. Assume that all commands (unless stated otherwise) are executed in some $ROOT_DIR (such as your home directory).
Start by tracing execution of this transaction.
sui replay --digest 95oR1YipjSnqd18K4BMshkLgPijypwzARHV988eRhMDs --trace
When you replay the transaction, the replay tool downloads data for all Move packages used by this transaction. In the case of this example, they reside in the $ROOT_DIR/.replay/95oR1YipjSnqd18K4BMshkLgPijypwzARHV988eRhMDs parent directory, with subdirectories named after package IDs:
0x0000000000000000000000000000000000000000000000000000000000000001
0x0000000000000000000000000000000000000000000000000000000000000002
0x2c8d603bc51326b8c13cef9dd07031a408a48dddb541963357661df5d3204809
0xb29d83c26cdd2a64959263abbcfc4a6937f0c9fccaf98580ca56faded65be244
0xdba34672e30cb065b1f93e3ab55318768fd6fef66c15942c9f7cb846e2f900e7
0xdeeb7a4662eec9f2f3def03fb937a663dddaa2e215b8078a284d026b7946c270
0xe0917b74a5912e4ad186ac634e29c922ab83903f71af7500969f9411706f9b9a
0xecf47609d7da919ea98e7fd04f6e0648a0a79b337aaad373fa37aac8febf19c8
The second directory on the list corresponds to the ID of the Sui framework package. To enable source-level debugging for this package, provide the replay tool with access to its debugging metadata: obtain the package source, build it, and copy the metadata to a specific location (source directory) in the Sui framework package subdirectory.
-
Clone the repository, unless you already have the Sui source code repository available.
git clone https://github.com/MystenLabs/sui.git -
Build Sui framework package source code.
cd sui/crates/sui-framework/packages/sui-framework; sui move build -
Copy the debugging metadata to the right location.
cp -r $ROOT_DIR/sui/crates/sui-framework/packages/sui-framework/build/Sui $ROOT_DIR.replay/95oR1YipjSnqd18K4BMshkLgPijypwzARHV988eRhMDs/0x0000000000000000000000000000000000000000000000000000000000000002/source
When you start a debug session and reach the Sui framework code during debugging, you will be in the source view rather than disassembly view.
Locating precise package versions
You should try to enable source-level debugging uniformly for all packages used throughout the transaction (both user-level and system packages), and use precise package versions to ensure a smooth debugging experience. This may not always be possible, but in such case, you can still locate precise versions of system packages to enable limited source-level debugging.
Start debugging the transaction to collect some more information about Move code executed in the transaction.

The PTB summary reveals that this transaction consists of only one Move call to the function add_deep_price_point, in module pool, in user package 0xb29d83c26cdd2a64959263abbcfc4a6937f0c9fccaf98580ca56faded65be244. Ideally, you want to be able to locate the buildable source code for this package and the correct version of the source code. Then, build debugging metadata for this package, which will automatically include information for all dependent packages, enabling uniform source-level debugging. Barring that, you might want to find the correct version of the source code for system packages to at least enable source-level debugging for Sui framework code.
Precise versions for all packages
To locate the correct version of the source code for a user package, utilize a Sui explorer (such as suiscan) and Sui's Move Package Registry (MVR).
Search for the package in a Sui explorer.
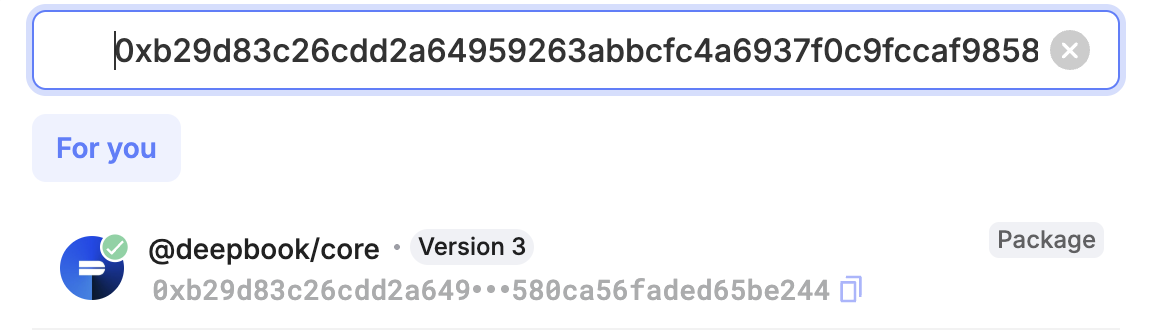
You can see that the the package in question is deepbook/core. Look at the detailed information about this package available in the explorer.
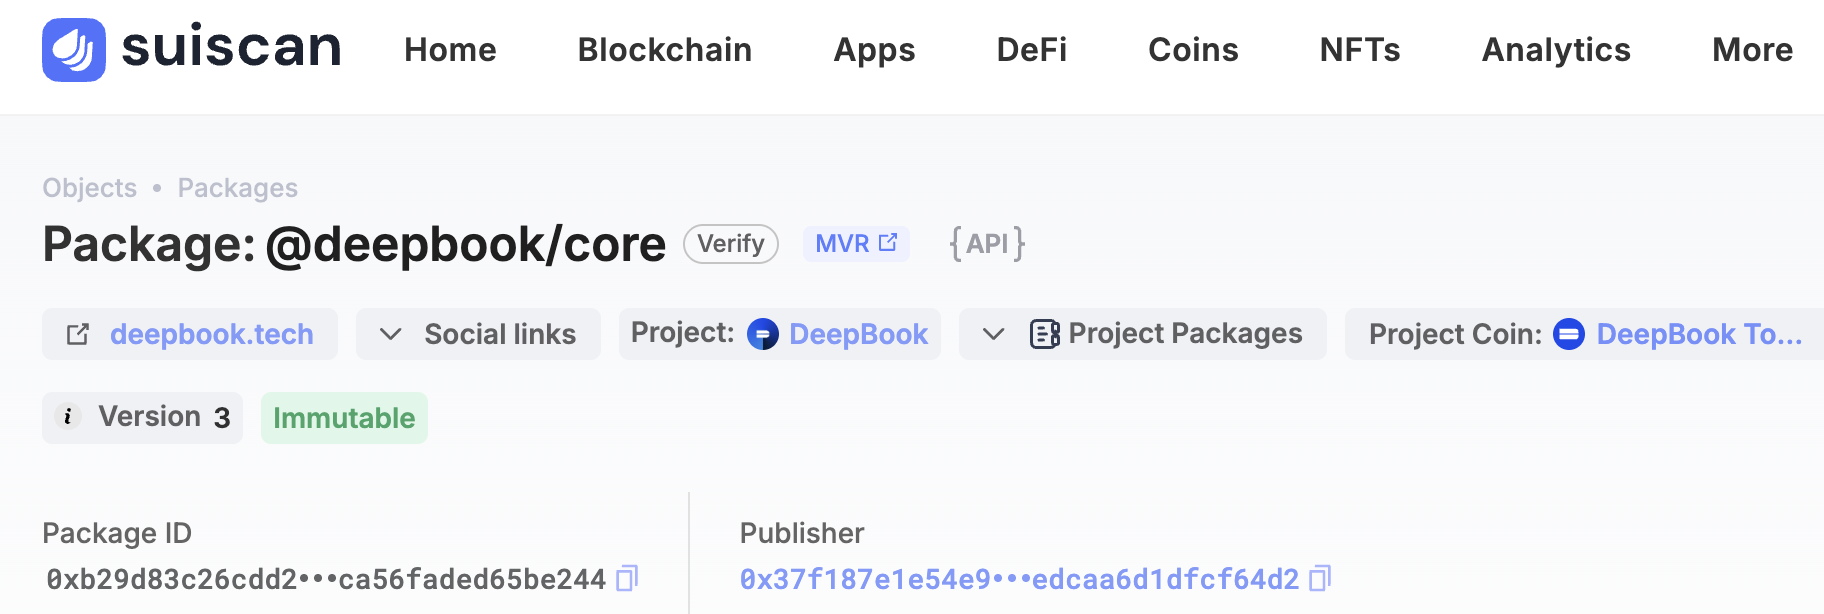
You can see that the package description in the explorer includes an MVR link. When you follow that link, you get to the MVR page containing a different kind of description for this package. The MVR description includes a link to the package's source code repository and information that the ID represents the 3rd version of this package.
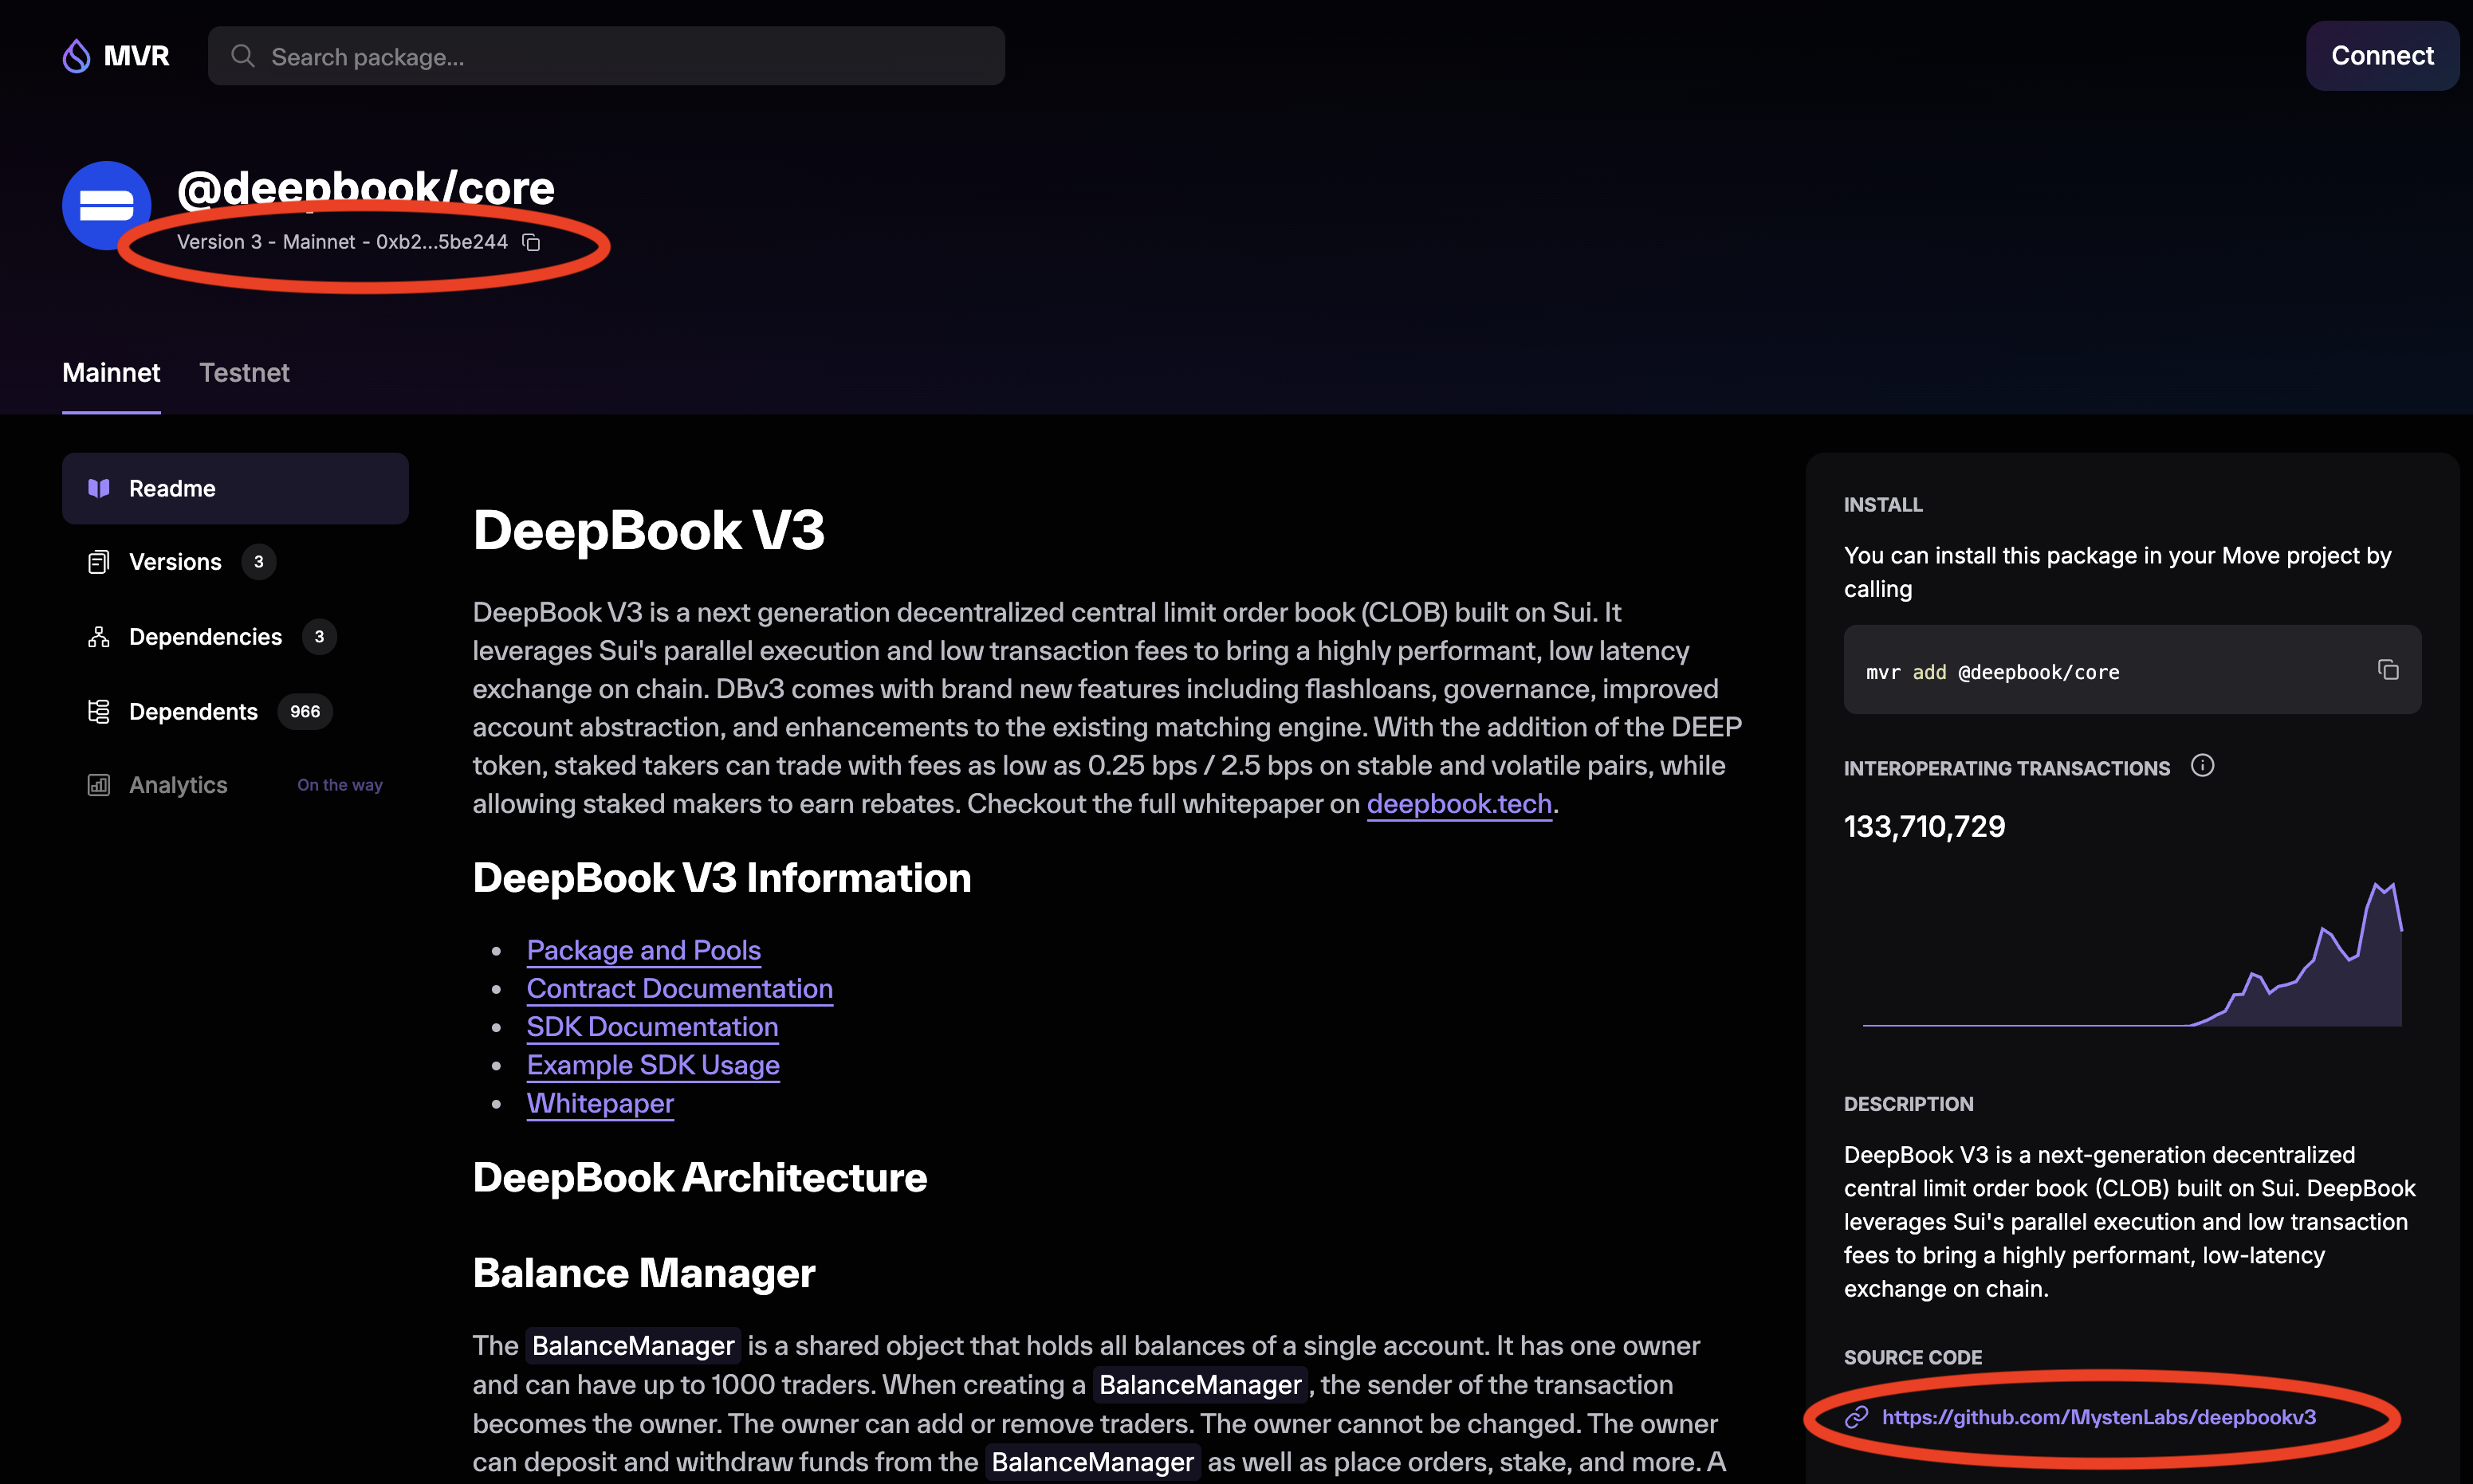
While the source code repository for deepbook/core contains three different packages, the pool module in the PTB is only defined in the deepbook package.
Proceed to building a correct version of this package to generate debugging metadata that must accompany the package source code. Assume that all commands are executed in $ROOT_DIR unless stated otherwise.
-
Clone the repository.
git clone https://github.com/MystenLabs/deepbookv3.git -
Go to the
deepbookpackage directory.cd deepbookv3/packages/deepbook -
Check the version tags.
git tag -lIn this repository, the tags indeed represent different package versions.
v1.0.0
v2.0.0
v3.0.0
Choose the exact version of the package to build.
git checkout v3.0.0If tags are not found, you can proceed directly to the next step, but there is no guarantee that the most recent version of source code in the repository corresponds to the version of the package on-chain, which may affect debugging capabilities.
-
Build the package and copying the debugging metadata.
sui move buildThis creates a
builddirectory with adeepbooksubdirectory in it containing all the relevant metadata, which you now copy to the right directory.cp -r ~/deepbookv3/packages/deepbook/build/deepbook ~/.replay/0xb29d83c26cdd2a64959263abbcfc4a6937f0c9fccaf98580ca56faded65be244/source
Precise versions for system packages
If you cannot locate sources for a user package, you can still locate source code and its correct version for system packages that the user package depends on. This allows you to at least view the source of system packages during the debugging session.
System packages in Sui (the Sui framework package in particular), might only change when the protocol version for Sui changes. These changes are tracked and include information about protocol version numbers (starting with 3) and corresponding git revisions that represent the exact version of the Sui framework package's source code at a given protocol version. This allows you to locate which protocol version was in effect when the user package was published on-chain.
Run the following query against the mainnet's GraphQL endpoint where the address parameter is the ID of the user package (0xb29d83c26cdd2a64959263abbcfc4a6937f0c9fccaf98580ca56faded65be244 in this example).
{
    object(address: "0xb29d83c26cdd2a64959263abbcfc4a6937f0c9fccaf98580ca56faded65be244") {
        previousTransaction {
            effects {
                epoch {
                    protocolConfigs {
                        protocolVersion
                    }
                }
            }
        }
    }
}
The result of this query looks as follows.
{
    "data": {
        "object": {
            "previousTransaction": {
                "effects": {
                    "epoch": {
                        "protocolConfigs": {
                            "protocolVersion": 84
                        }
                    }
                }
            }
        }
    }
}
In this example, the user package was published at protocol version 84. The corresponding git revision from the protocol version tracking file is 25804c243d07dd73c0d199e7794383bd855cd436. Now, you can follow the debugging metadata generation instructions for Sui framework code. The only difference is that before building the framework package, you need choose the right git revision.
git checkout 25804c243d07dd73c0d199e7794383bd855cd436